
*The information, opinions and judgments on markets, projects, currencies, etc. mentioned in this report are for reference only and do not constitute any investment advice.
When the United States and Hong Kong successively approved BTC ETFs and we cheered for the integration of DeFi and TradFI, we were not aware of the profound changes that had taken place in the Crypto market structure.
Which parts of the market are changing, which parts have not changed, which new factors have been added to influence market trends, and which existing factors still play a huge role... This is what investors like us who are trying to explore market trends and industry cycles need to understand.
In April, policy expectations changed again and global financial markets experienced severe fluctuations.
Macro Finance
For BTC, which is worth more than $1.2 trillion, its strong correlation with the Nasdaq is well known as its market value expands and the participating groups change, which makes macroeconomics, financial data and global central bank policies the most important factors affecting BTC price trends in many cases. April is the month when these data took over BTCs trend.
The US CPI data for March released in April was as high as 3.5%, exceeding 3.2% in February. The unexpected rebound of CPI has caused the markets expectations for the US interest rate cut in the first half of the year to fall to the freezing point. The market has previously paid much attention to the pressure on US government bond interest rates in a high-interest environment. However, in the context of the Feds current core task - to reduce CPI to below 2%, which is hopeless, no one doubts that the interest rate cut will be delayed again. There are even voices that believe that there is no hope for a rate cut this year, and there may be another rate hike - this is not impossible. If the CPI rebounds sharply, what else can the United States do besides raising interest rates?
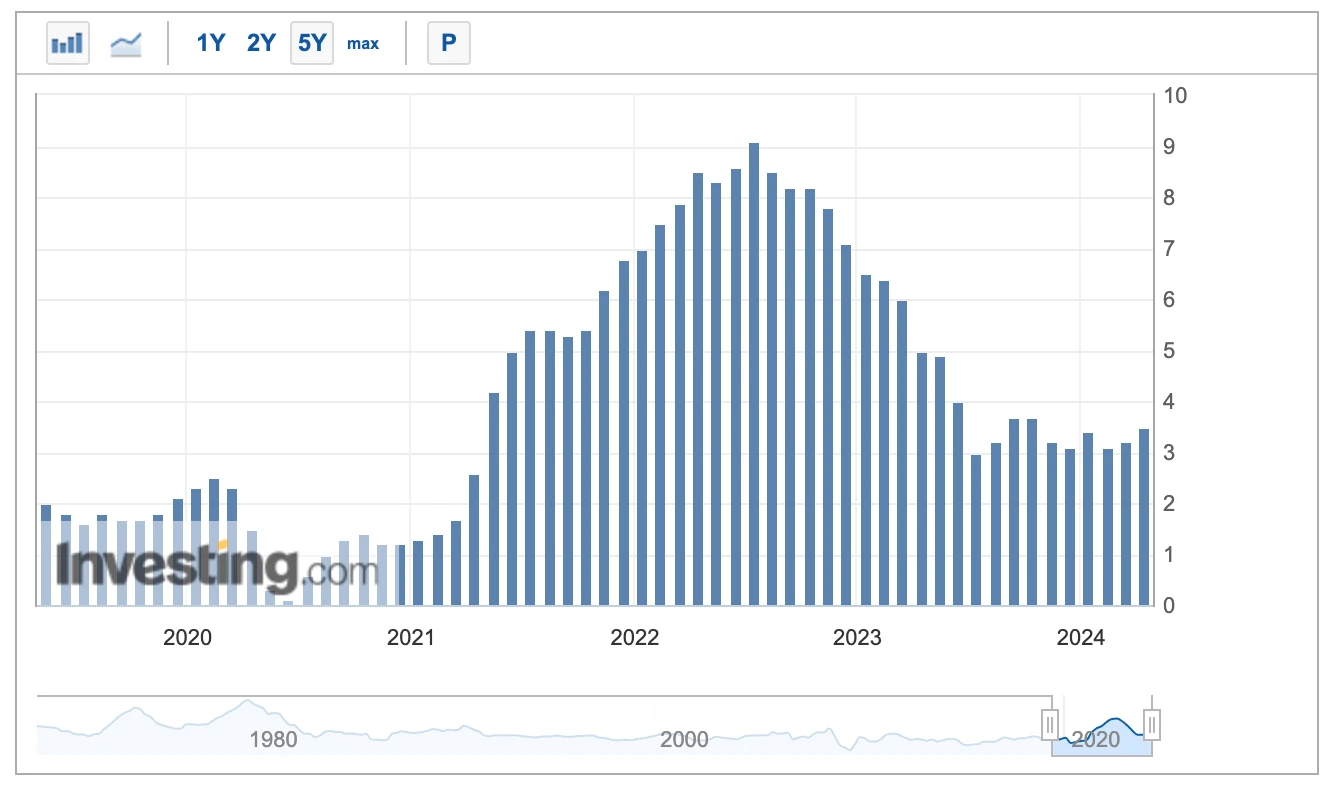
US CPI index rebounds for two consecutive months
At the same time, the Federal Reserves balance sheet reduction plan remains firmly implemented.
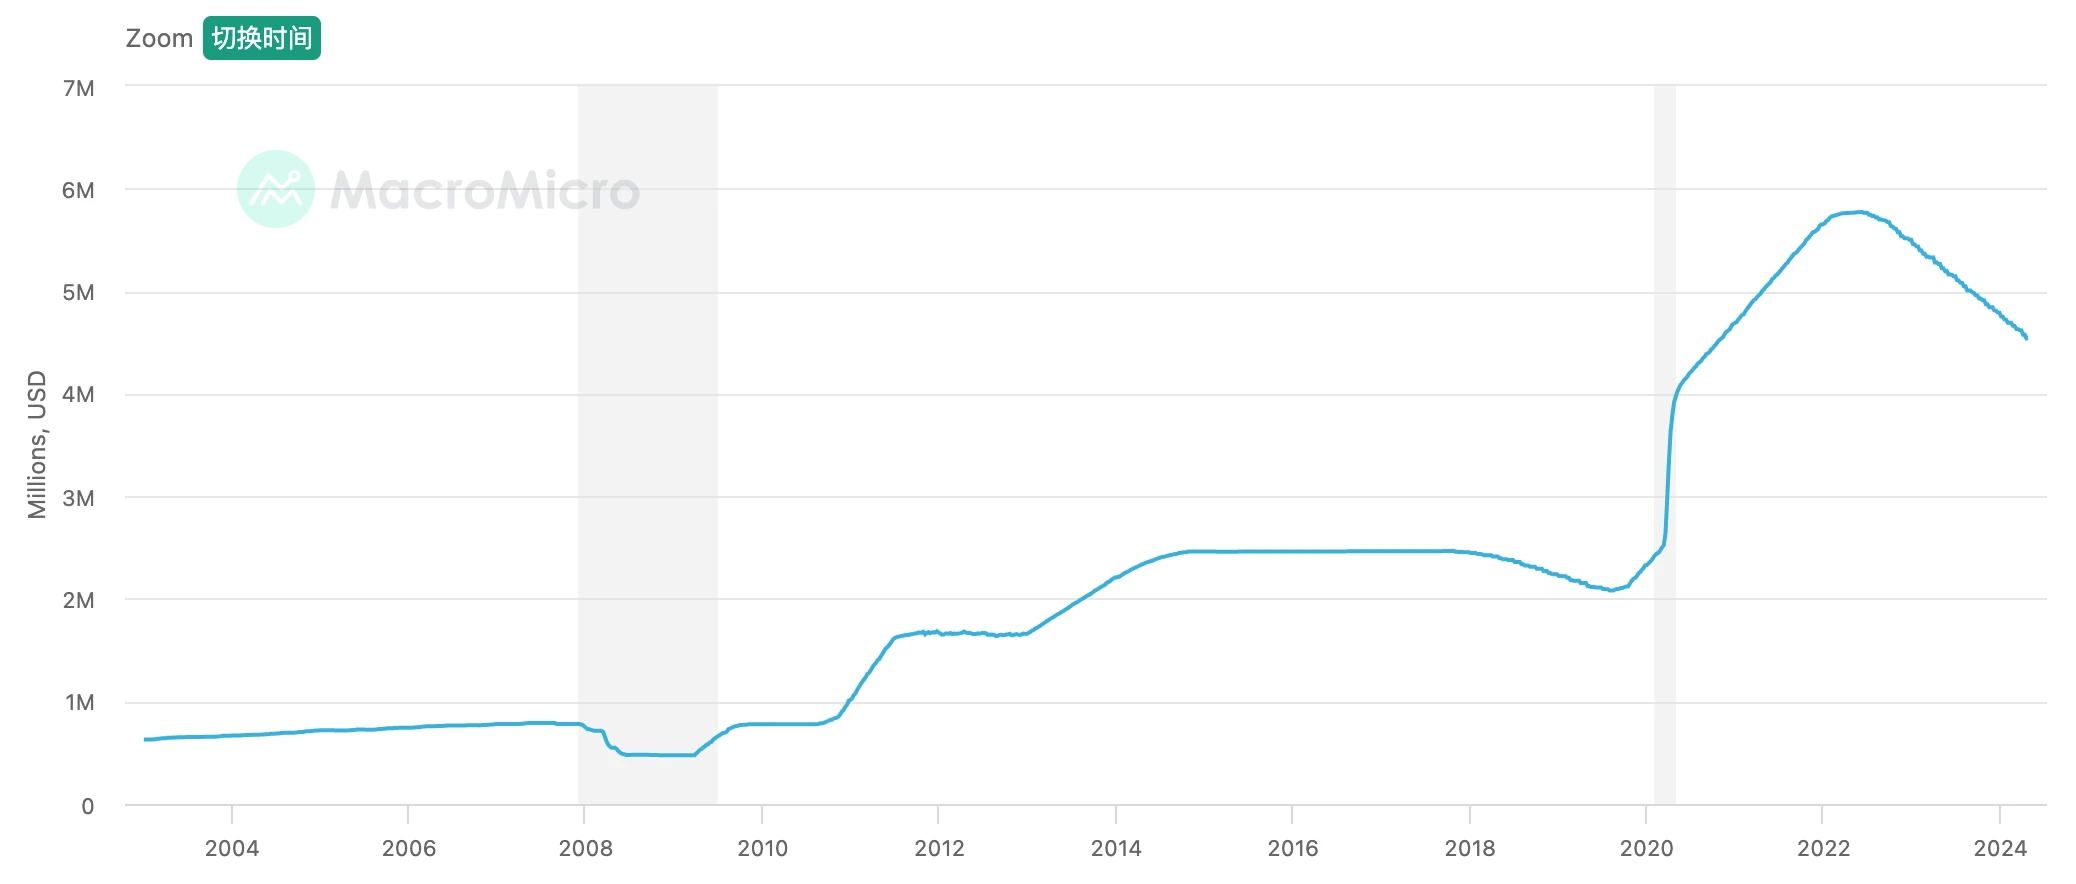
The Feds holdings of U.S. debt
Since the launch of the balance sheet reduction in 2022, the Federal Reserve has sold more than $1.2 trillion of U.S. Treasury bonds. This is another powerful pump under the background of high interest rates. This pump extracts up to $95 billion in liquidity from the market every month (60 billion U.S. Treasury bonds and up to 35 billion institutional bonds).
The pessimistic expectations and changes in response strategies caused by the above two points have pushed the US dollar index to continue to strengthen, and ended the five-day winning streak of the Nasdaq and the Dow Jones this month. After hitting record highs in March, the two indexes fell by 4.41% and 5.00% respectively this month.
Correspondingly, BTC, which completed production cuts this month, also ended its 7-game winning streak, with a monthly decline of $10,666.80, or 14.96%. After breaking through the rising channel in March, the effort to build a shock box in April seems to have failed.
A storm is about to rise, and the tide seems to be turning?
Crypto Market
In April, BTC opened at US$71,291.50 and closed at US$60,622.91, down 14.96% for the month with an amplitude of 19.27%, ending its seven-month rally. With trading volume shrinking, it experienced its largest monthly decline since January 2023 (that is, since the current bull market recovery period).
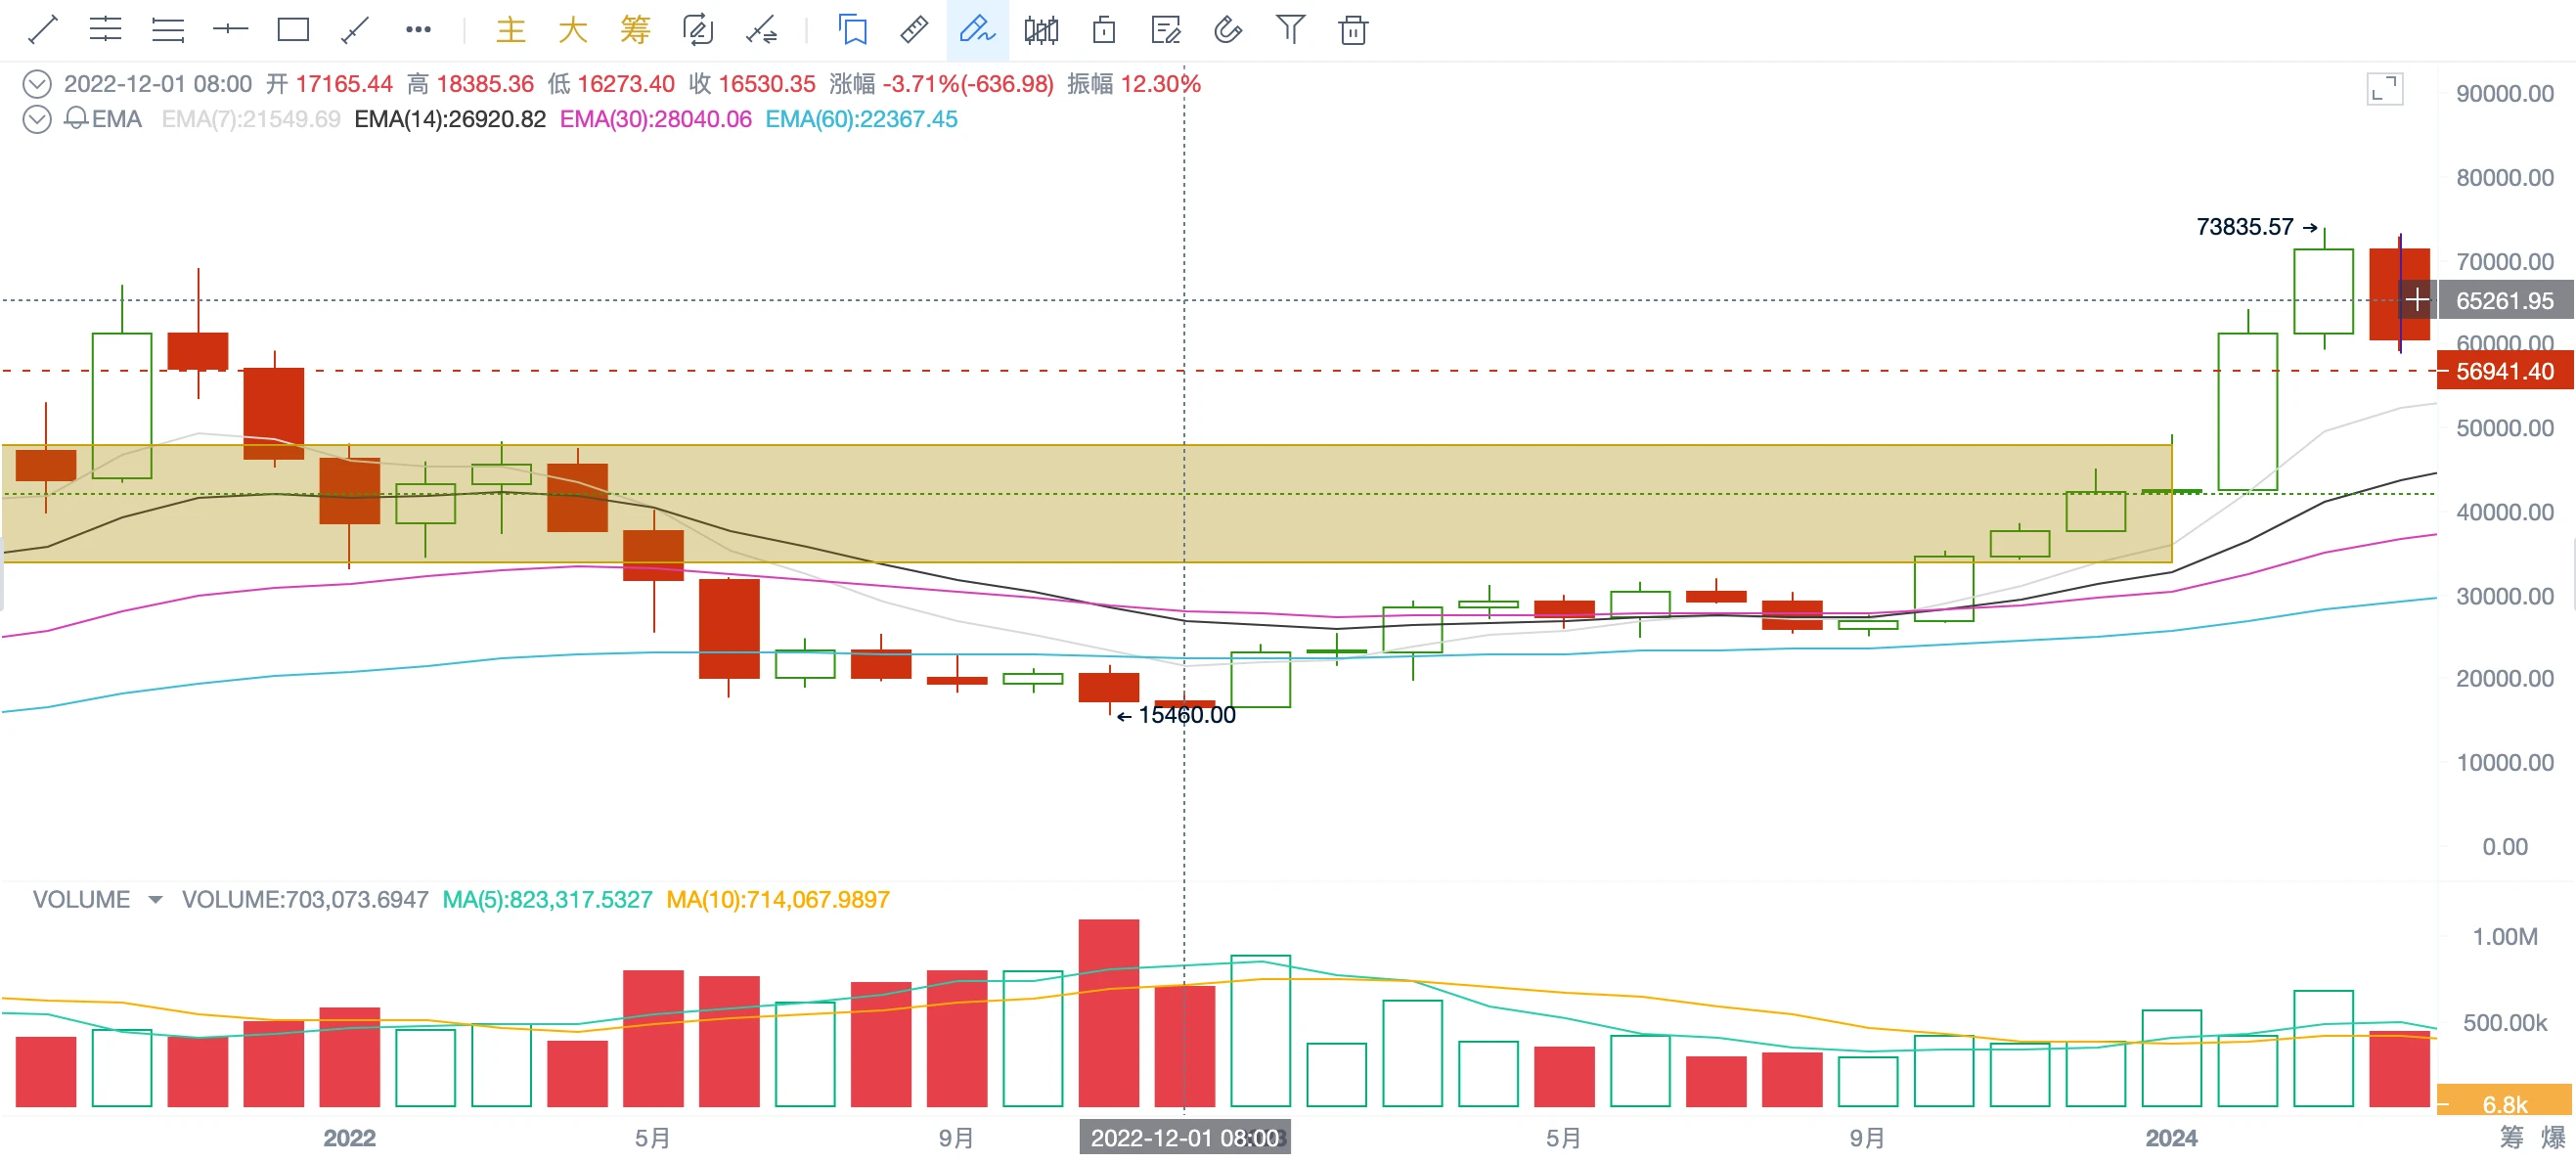
BTC monthly trend
After the big sell-off in March, the buying power of BTC suffered a major setback and has been weak since then. In April, it has been running below the 7-day average price for most of the time since mid-to-late April, and hit an adjustment low of $59,573.32 on April 19.
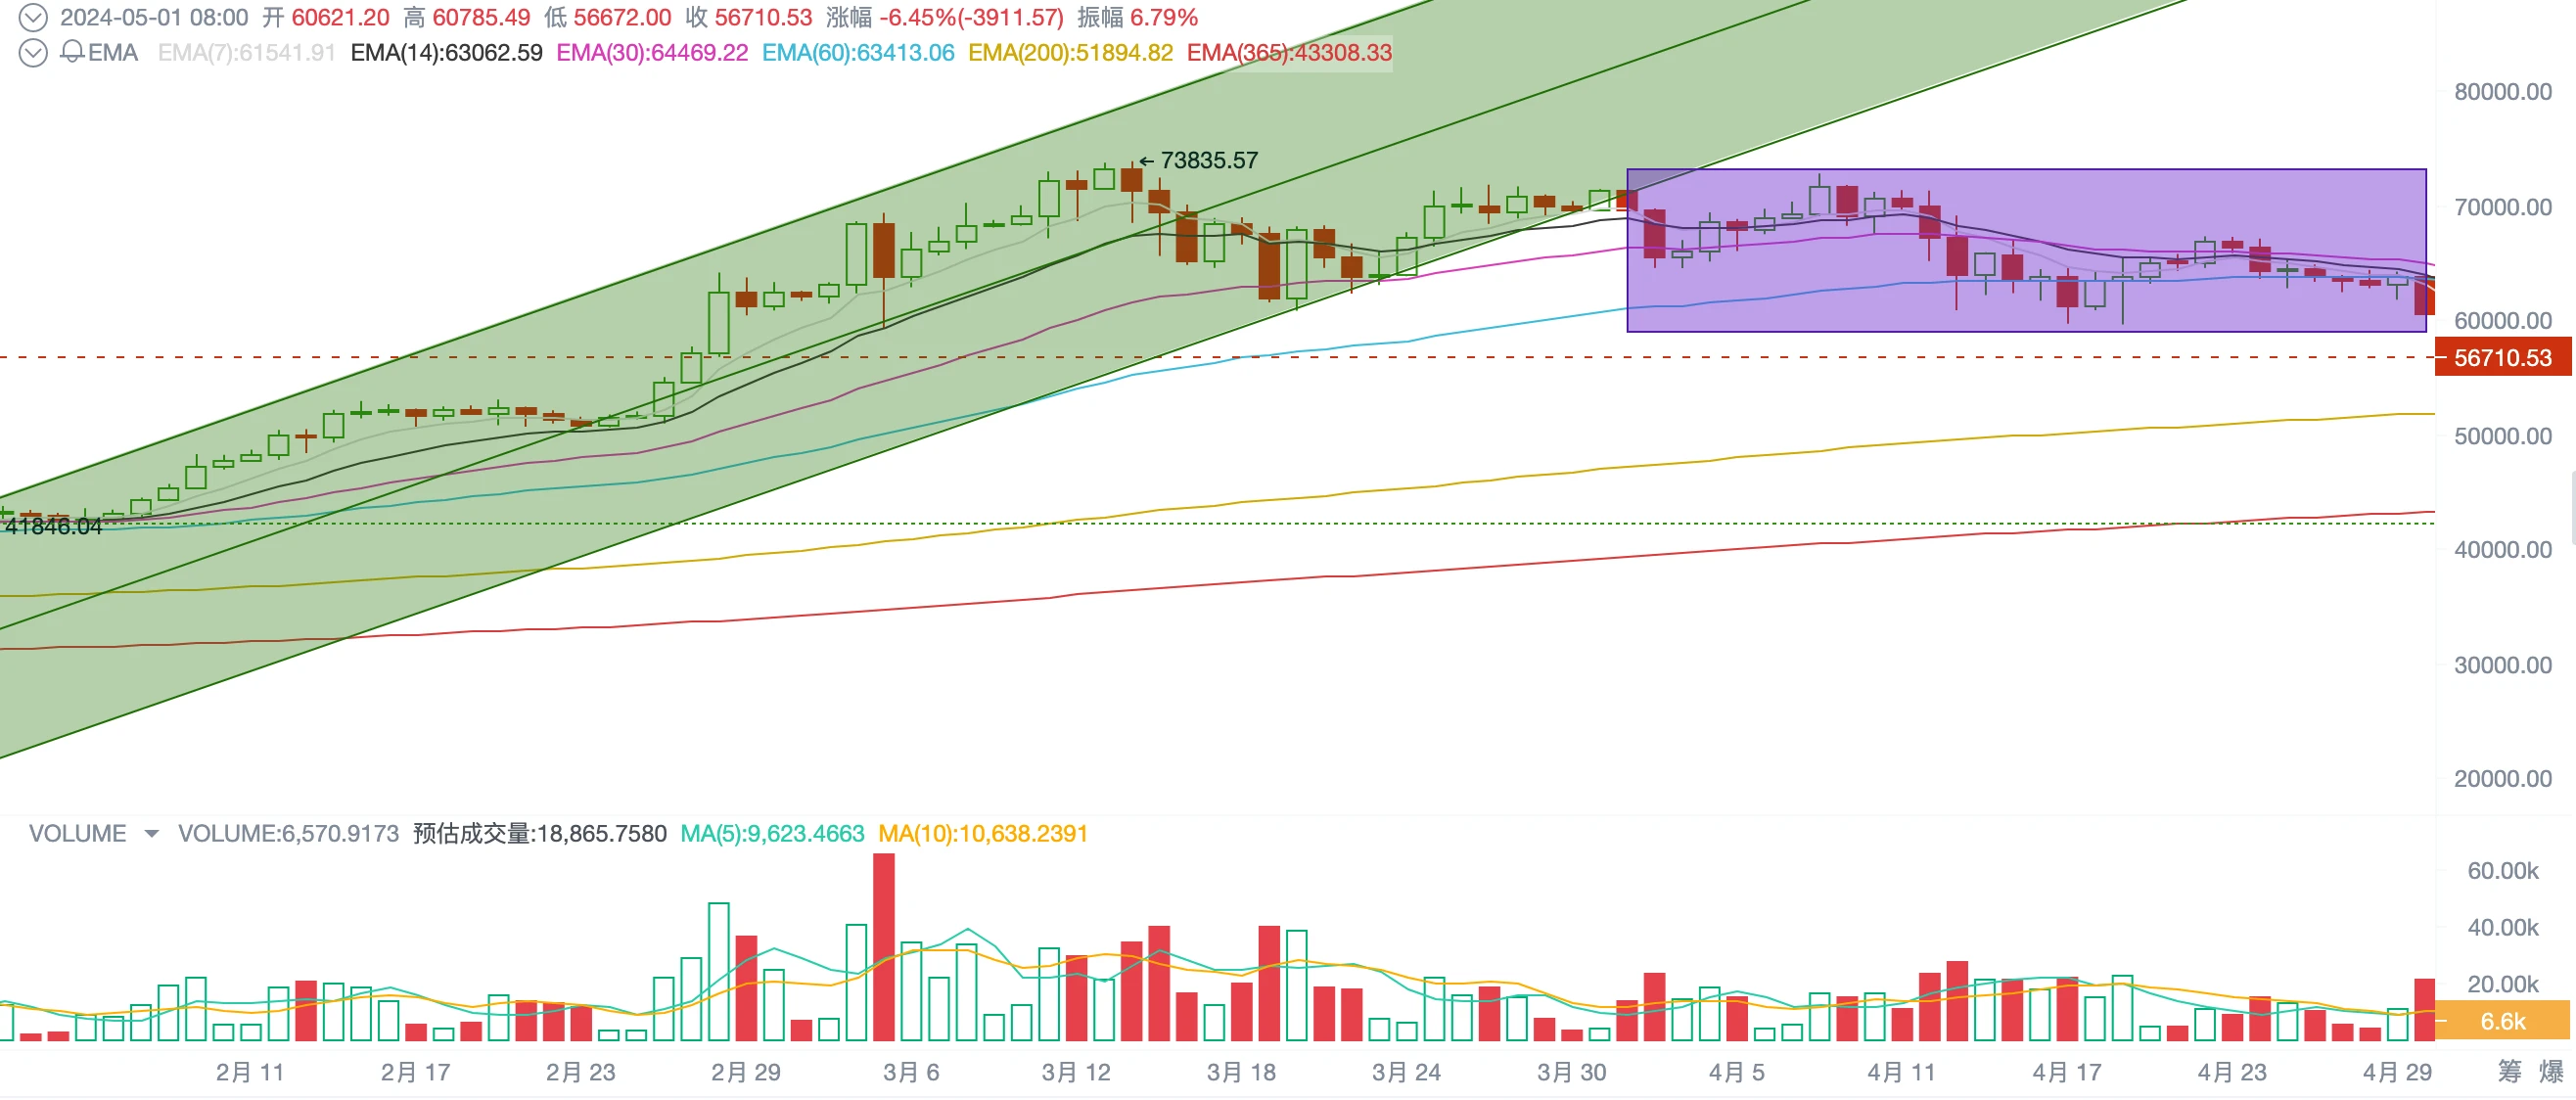
BTC daily trend
Since February, BTC has established a bull market price rising channel on the daily dimension (the green background part in the above picture). After hitting the historical highest price on March 13, it started to detect the lower track of the rising channel. Then, throughout April, it tried to build an oscillation box between US$59,000 and US$73,000 (the purple background part in the above picture). With the shift in macro-financial expectations and the breakdown of US stock indexes, the action of building an oscillation box has become difficult.
Sell and Hold
In the March report, we mentioned that December 3, 2023 was the highest point in the history of long-hand holdings, when long-handers held a total of 14,916,832 BTC. Since then, with the gradual start of the bull market, long-handers have begun their four-year cyclical sell-off, and as of March 31, a total of 897,543 BTC have been sold.
The biggest positive for the BTC narrative in January - the fulfillment of the approval of 11 spot ETFs, caused long-term investors to sell off at all-time highs, resulting in short-term saturation and cooling of enthusiasm for new short-term positions.
This behavior is a response to the phased rise of BTC, and is also the reason why the price of BTC stopped rising in March and entered a period of continuous fluctuations. After entering April, the trend of from long to short in the bull market stage within the market was suspended.
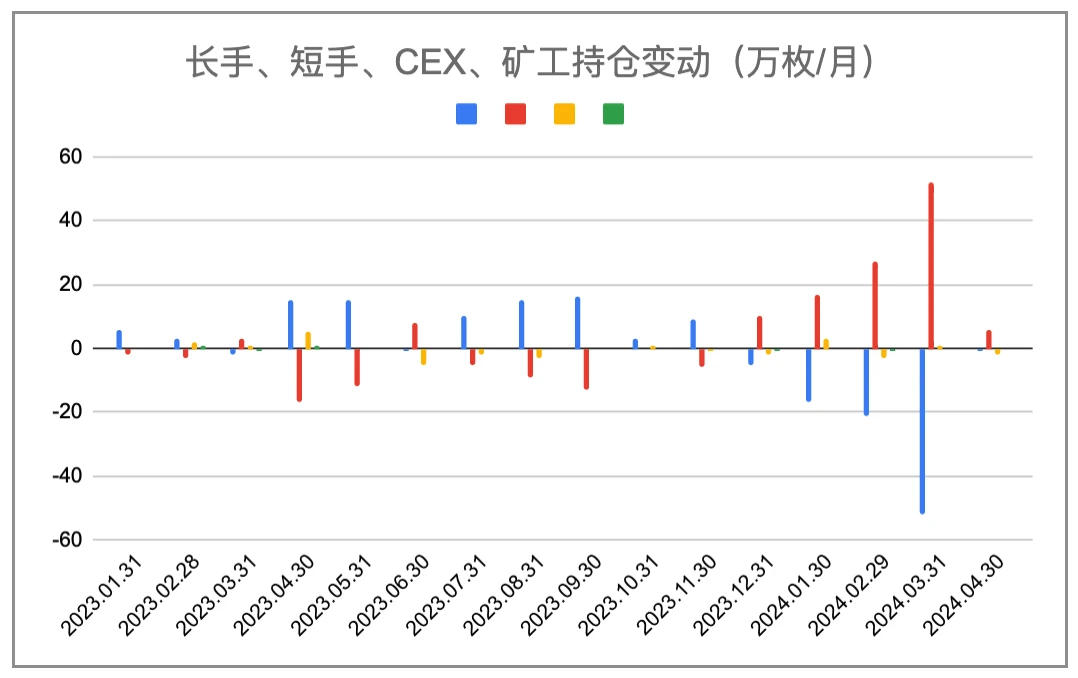
Changes in BTC positions of various market participants (monthly)
According to statistics, the selling volume of long-term holders decreased to 10,000 coins in April (the selling volume in March was as high as 520,000 coins). As the price fell, short-term holders increased their holdings this month, not only swallowing up the selling of long-term holders, but also withdrawing tens of thousands of coins from the balance of centralized exchanges.
With the completion of BTC production cuts this month, miners are still holding onto their coins (the overall position remains unchanged, which means the market sell-off is approximately equal to the output). Although the downward price is approaching the cost price of some miners, a large sell-off has not occurred, and miners are still holding about 1.81 million BTC stably.
From the statistical chart of the holding size of each party, we can clearly see the pause of the from long to short trend.
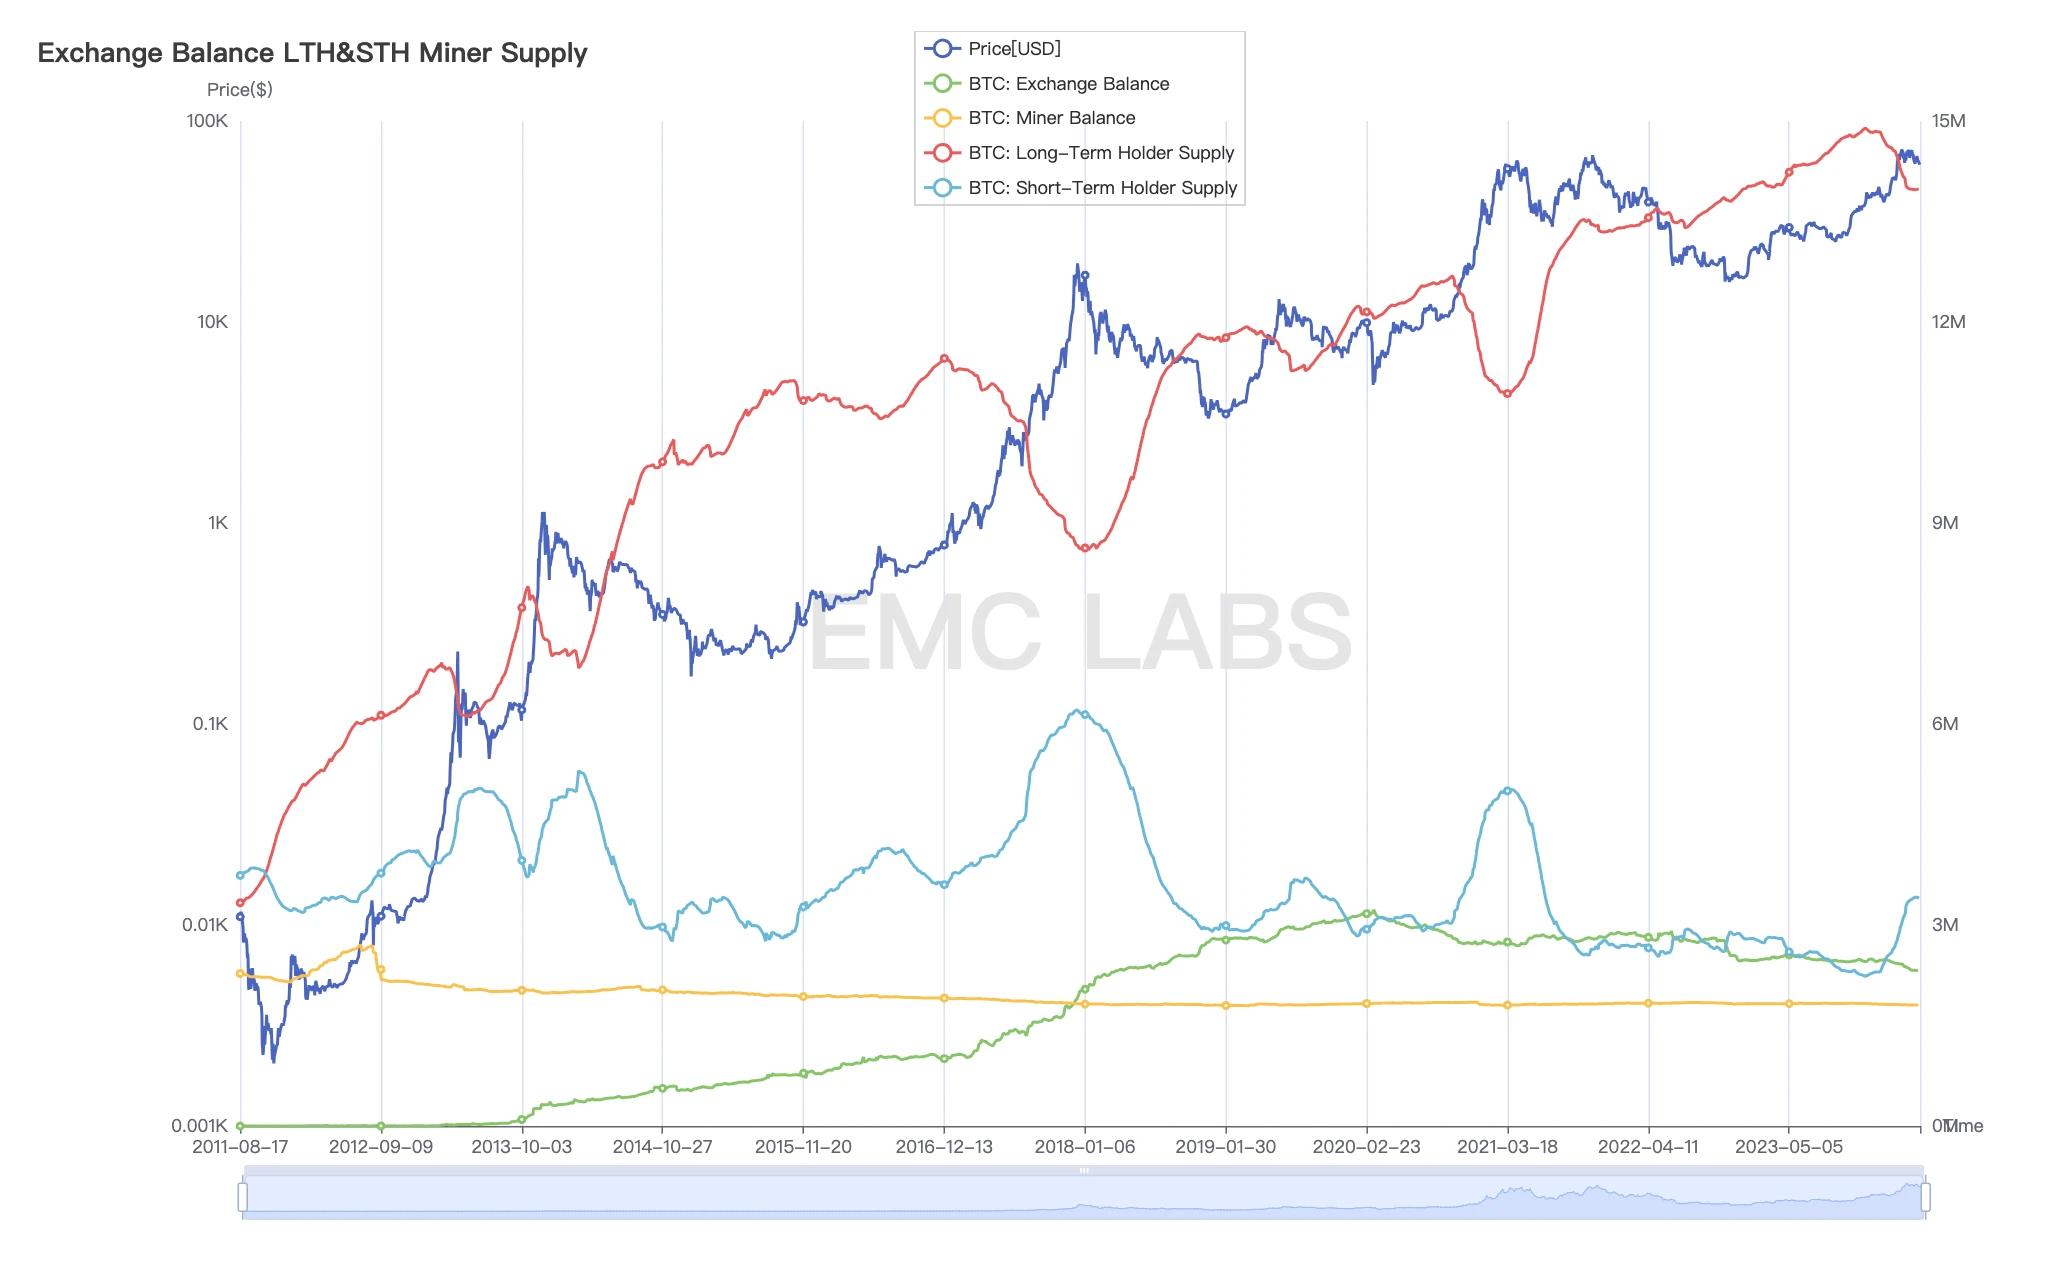
BTC holdings by all parties
Looking at the changes in the data of positions held by all parties over the past 11 years, we can find that the phenomenon of long-term selling being suspended in the middle of the bull market also occurred in mid-2016. This often means that as prices fall sharply, the long-term group who believe that the bull market will continue chooses to stop selling and restart selling after the market restores the supply and demand balance and continues to rise.
The pessimistic expectations and changes in response strategies caused by the above two points have pushed the US dollar index to continue to strengthen, and ended the five-day winning streak of the Nasdaq and the Dow Jones this month. After hitting record highs in March, the two indexes fell by 4.41% and 5.00% respectively this month.
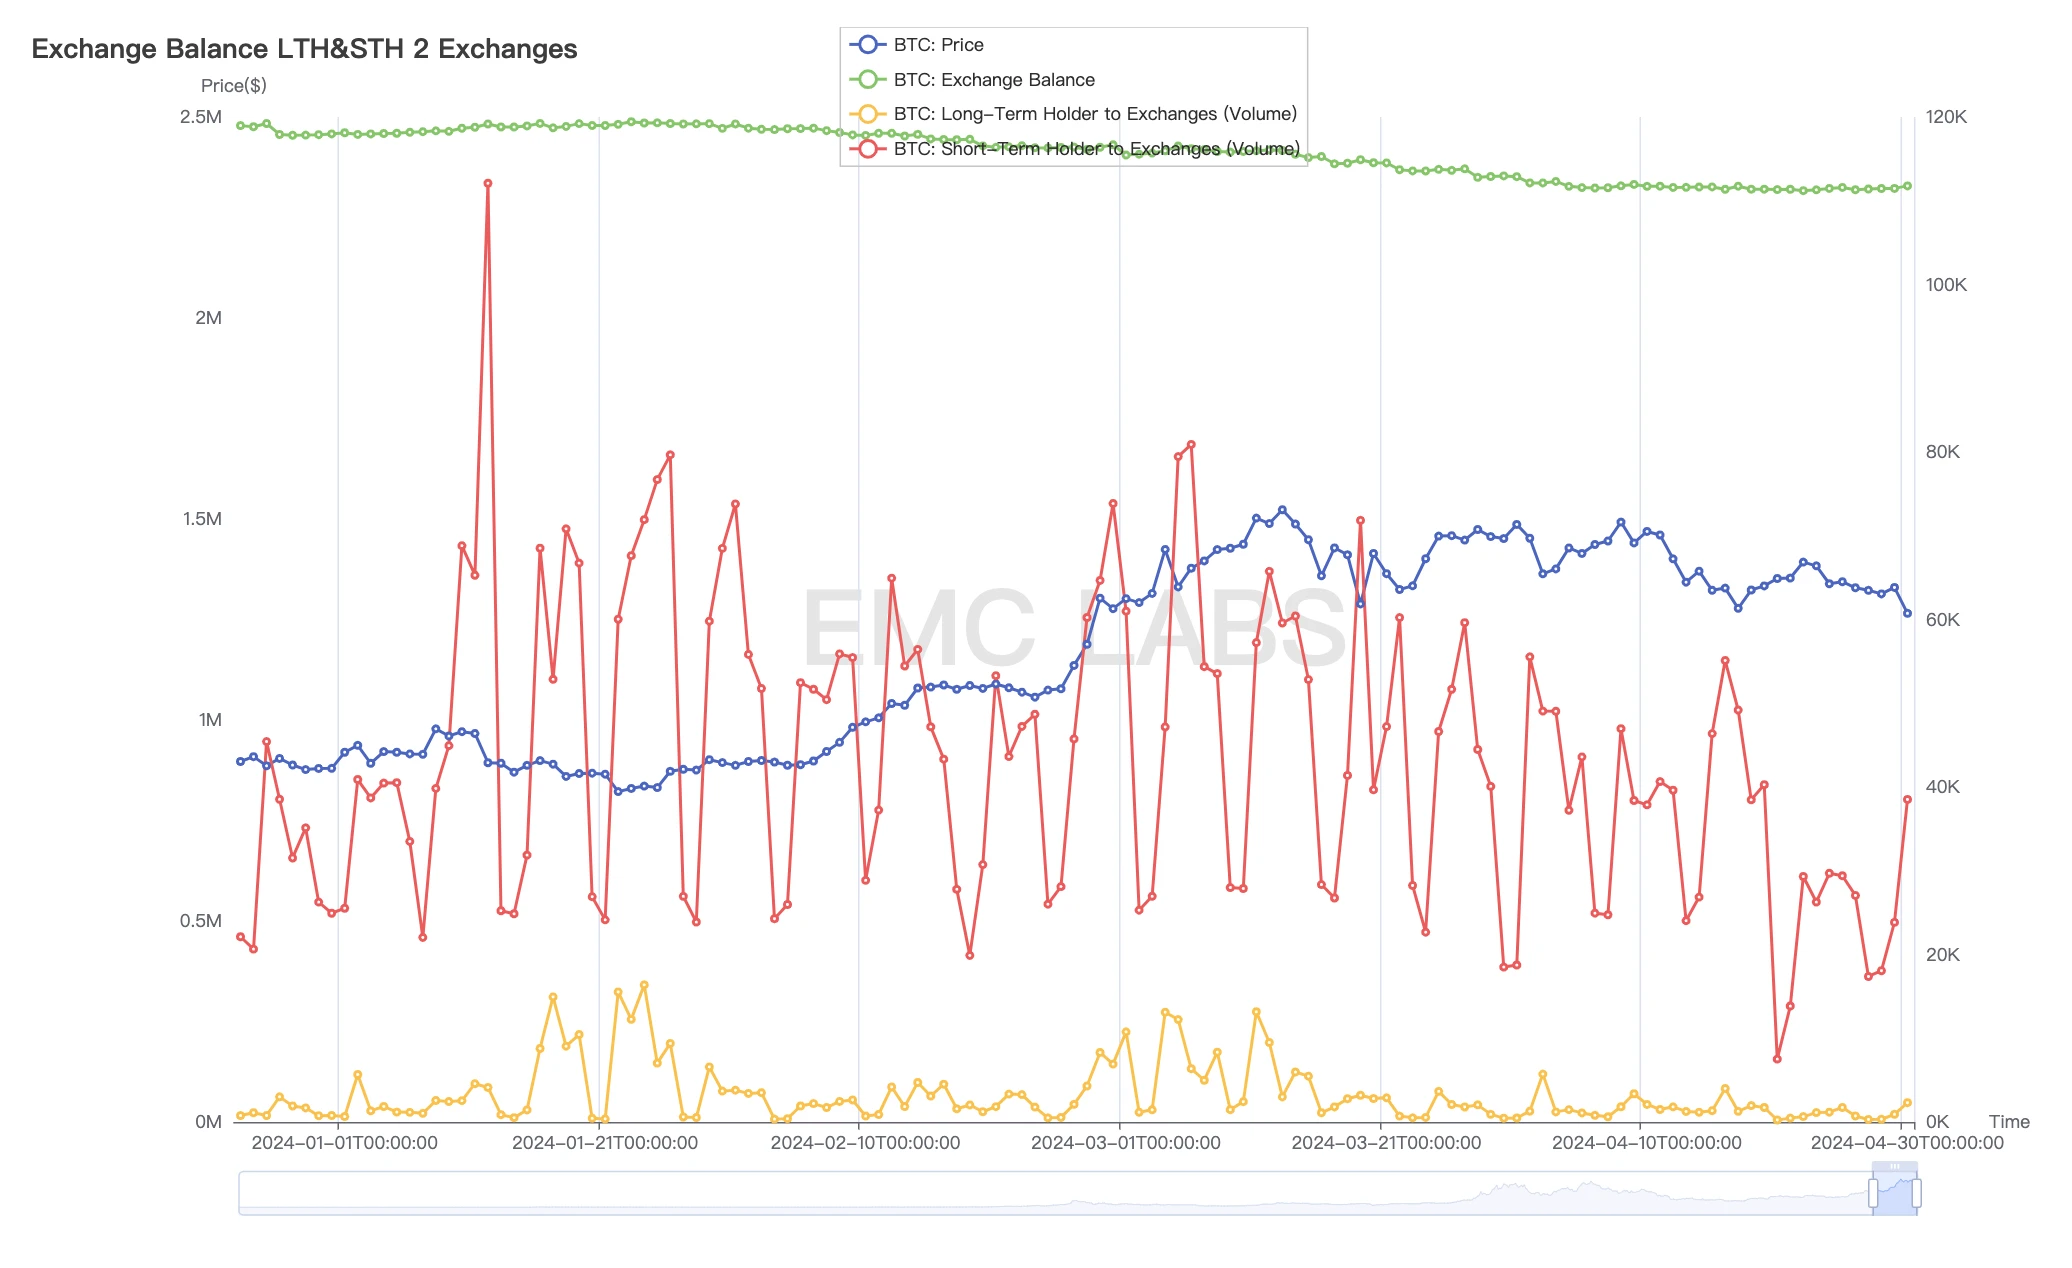
Long and short selling volume and CEX accumulation statistics (daily)
Judging from the data of BTC transferred from long and short hands to exchanges, the scale of transfers in April continued to decline compared to March, and the inventory of centralized exchanges did not change much and there was a small outflow.
liquidity
Funds are an important factor in determining market trends. After observing the internal structure of the market, we continue to examine the inflow and outflow of funds.
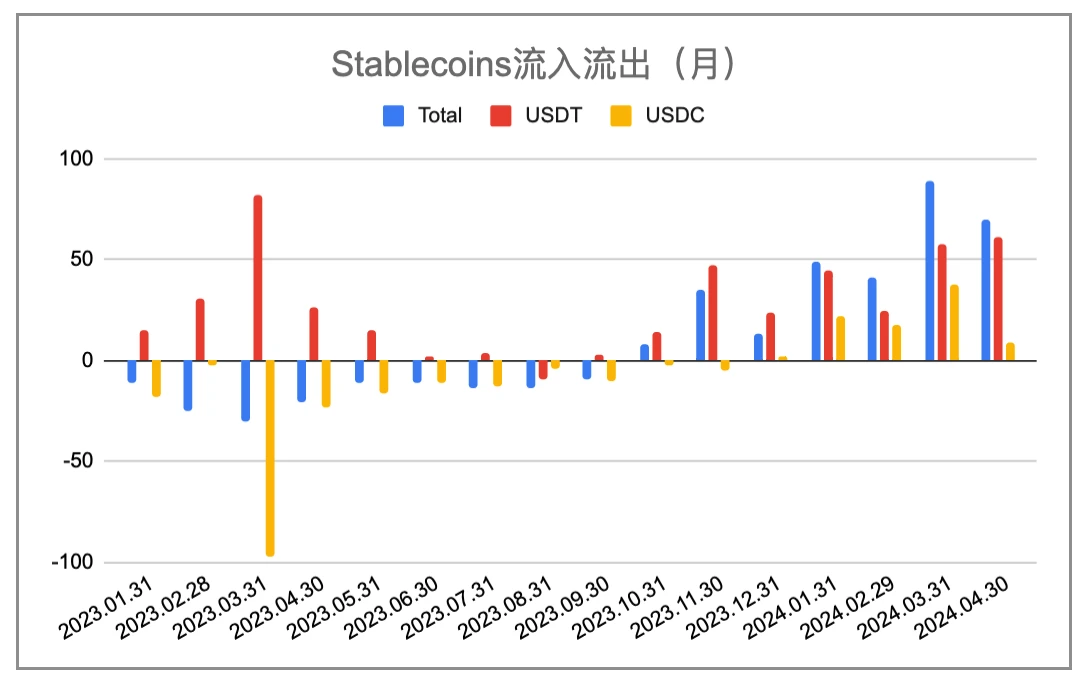
Changes in the supply of major stablecoins (EMC Labs chart)
Insighting into the stablecoin issuance data, EMC Labs found that the funds entering the market with the help of stablecoins in April reached $7 billion, including $6.1 billion in USDT and $900 million in USDC. According to eMerge Engine, BTC entered the repair phase of this cycle in 2023, and then achieved net inflows for the first time in October. Since then, stablecoins have been in a state of increasing issuance, and ranked second with an inflow of $7 billion in April.
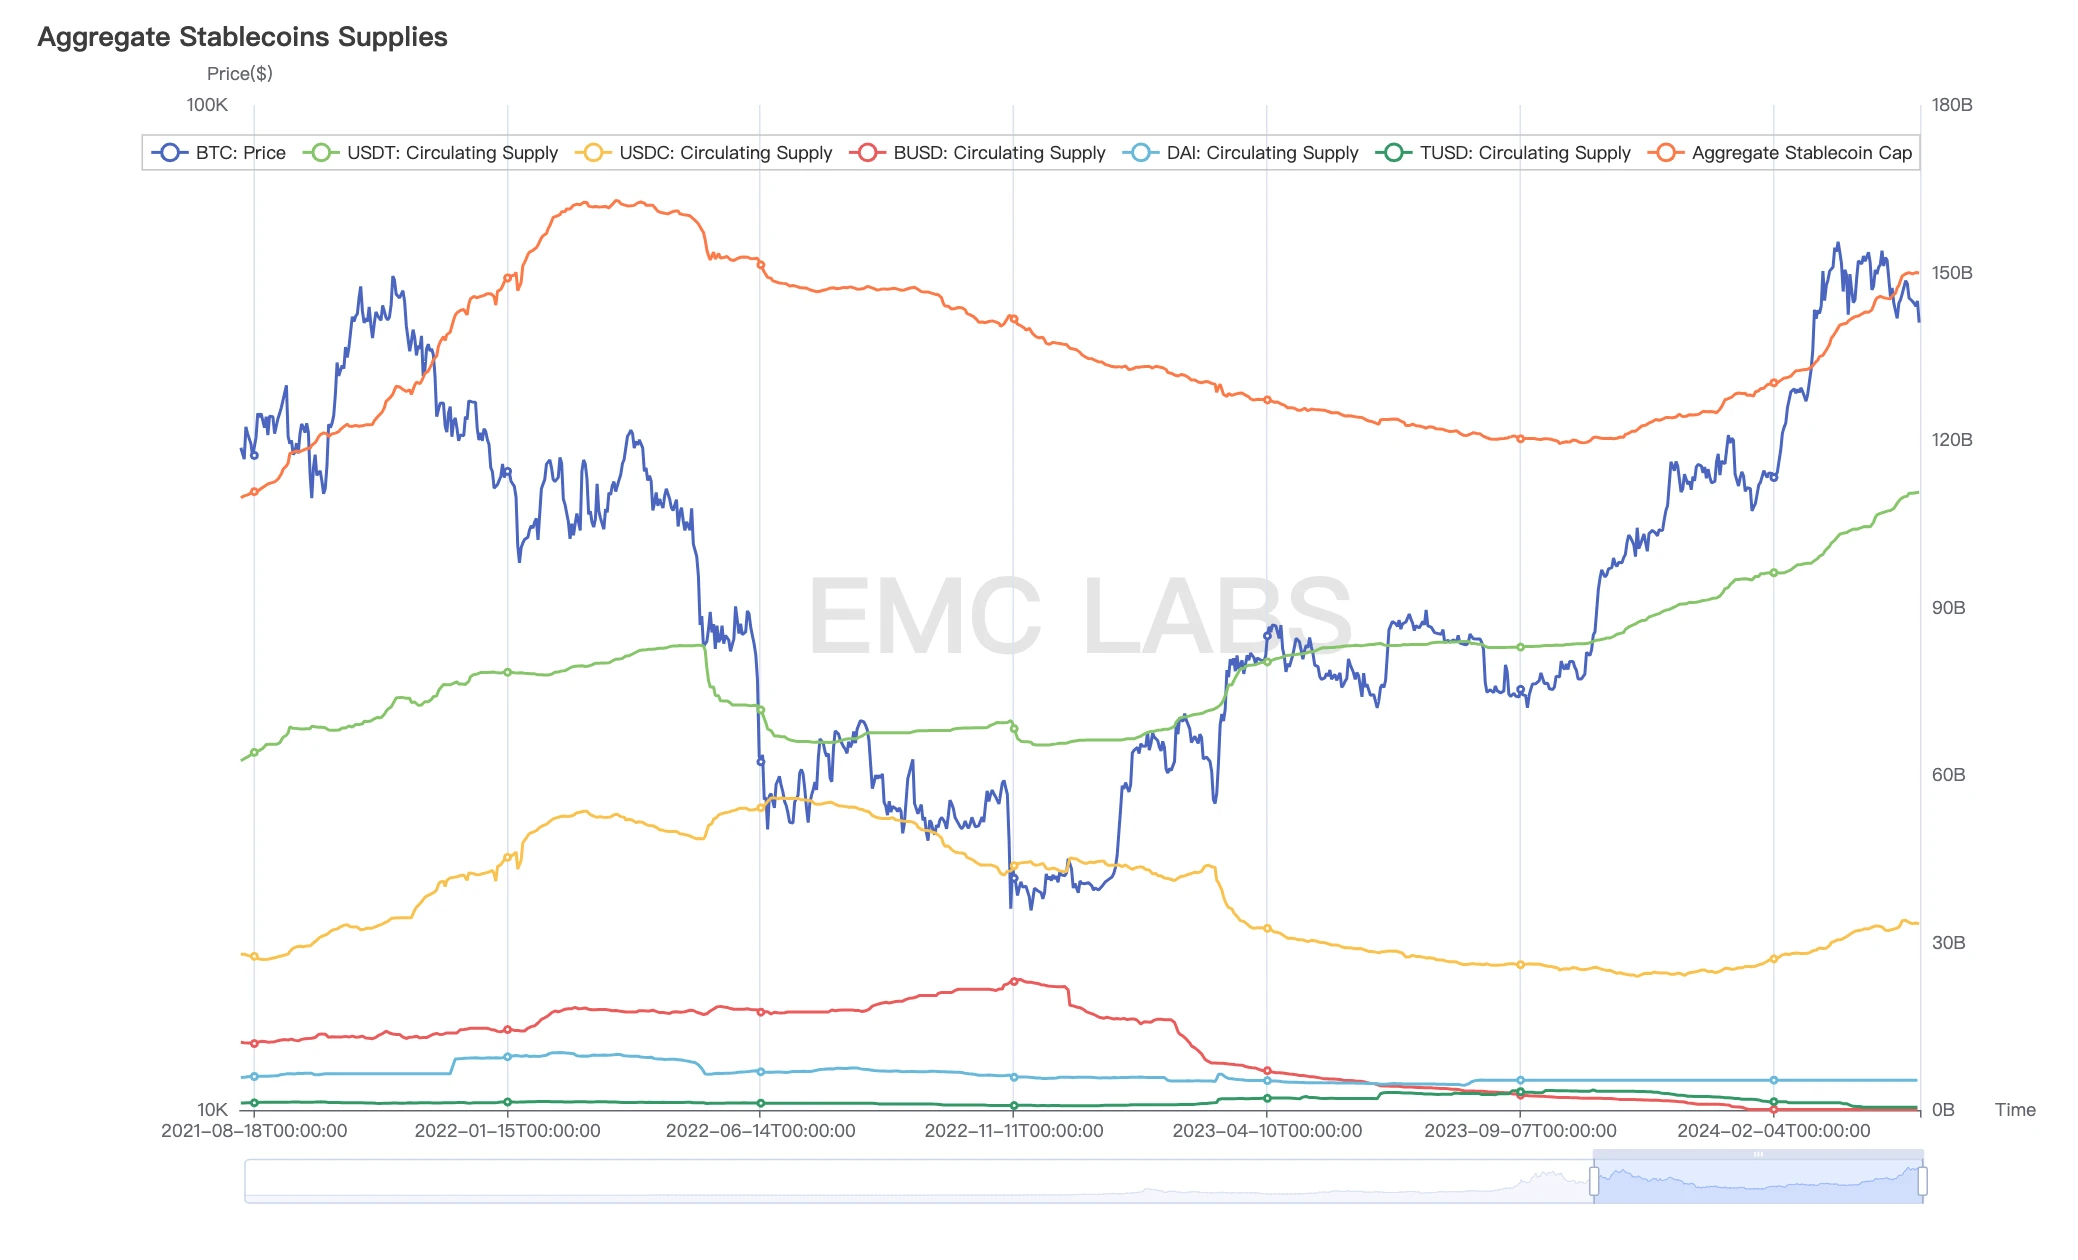
Issuance scale of major stablecoins
As of April 30, the total issuance of stablecoins has grown to approximately 149.9 billion, an increase of approximately US$30 billion since the low point, but has not yet reached the peak of the previous cycle.
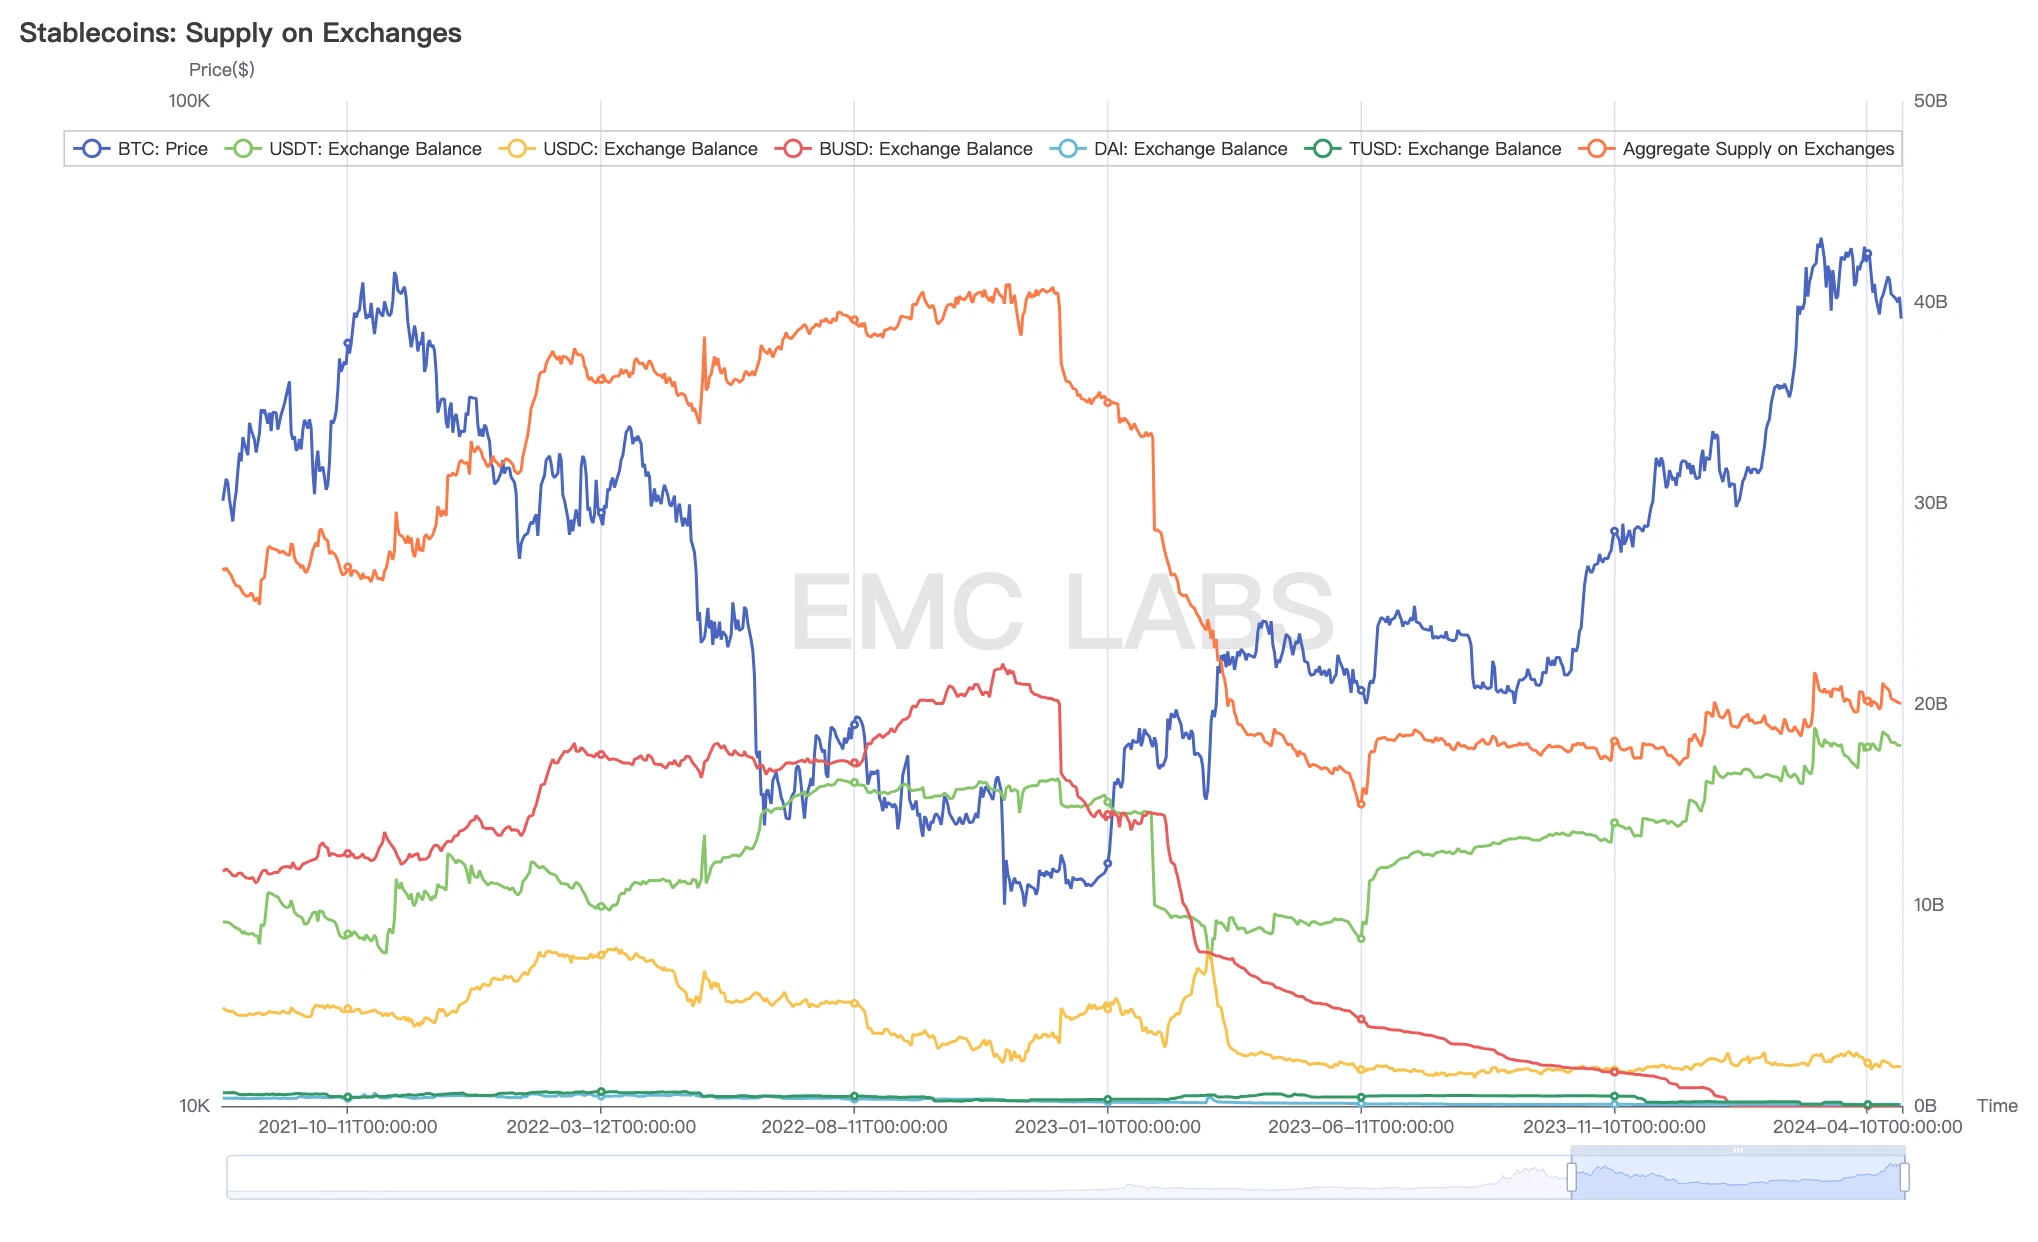
Furthermore, the stock of stablecoins in centralized exchanges also remains relatively high. However, these funds do not seem to be in a hurry to convert into purchasing power. It is worth noting that the main body of newly accumulated stablecoins in centralized exchanges is USDT, while USDC used in the US has basically no new accumulation.
On the BTC ETF channel side, the inflow and outflow of funds showed a relatively obvious feature of chasing highs and selling lows. Since the price stopped rising in mid-March, it has continued to flow out.
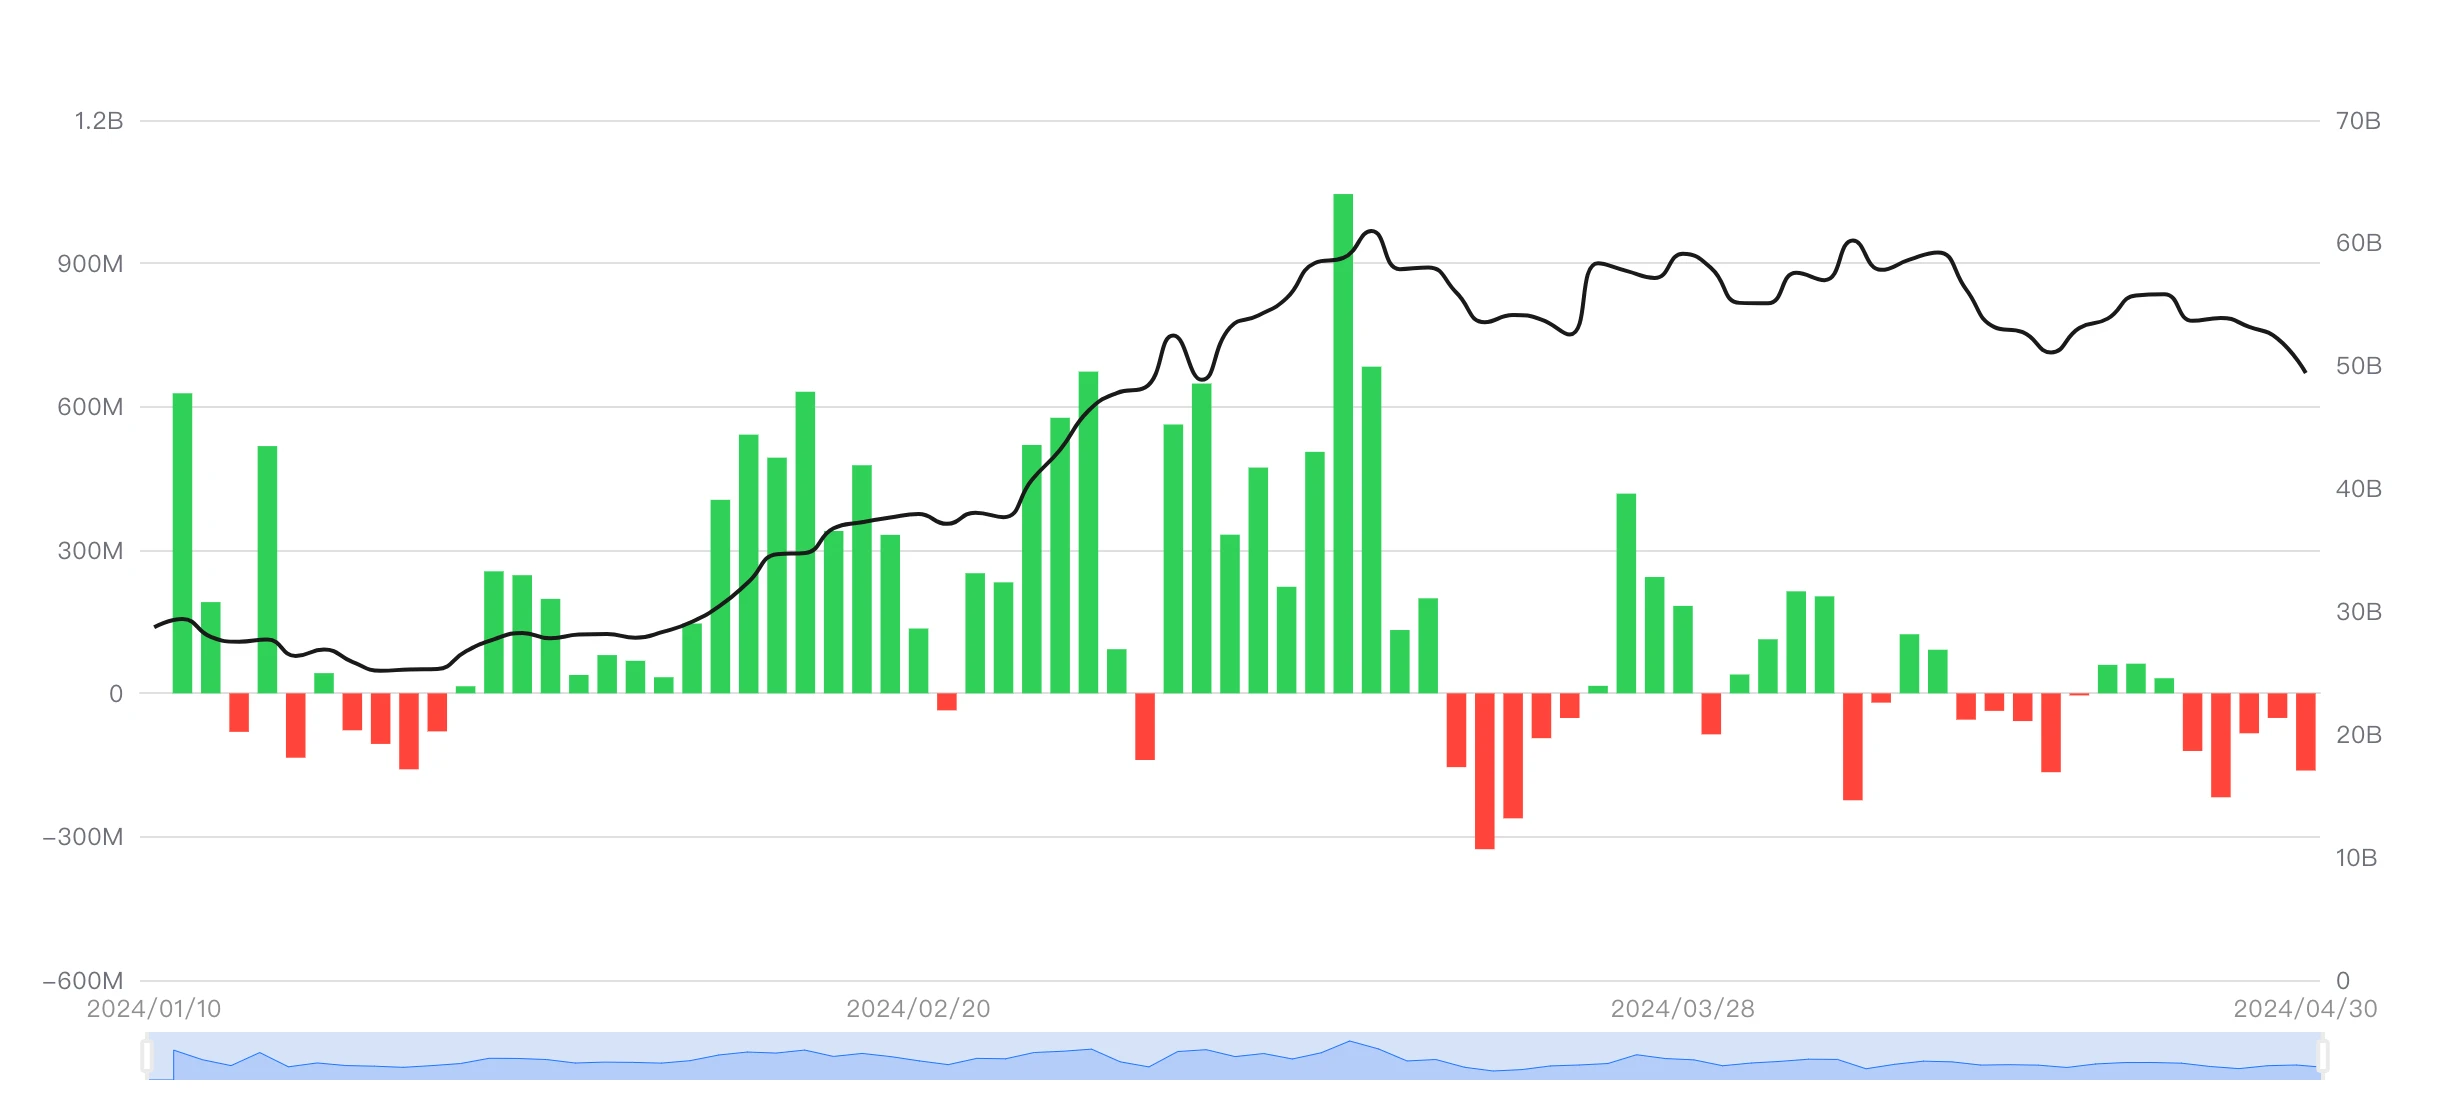
Statistics of inflows and outflows of 11 BTC ETFs (Chart by SosoValue)
Based on its fund characteristics and size, we believe that the funds in the BTC ETF channel are neither the main reason for the decline in BTC prices nor can they independently assume the responsibility of reversing the situation.
Supply pressure and cycle
All things flourish and wither in an endless cycle.
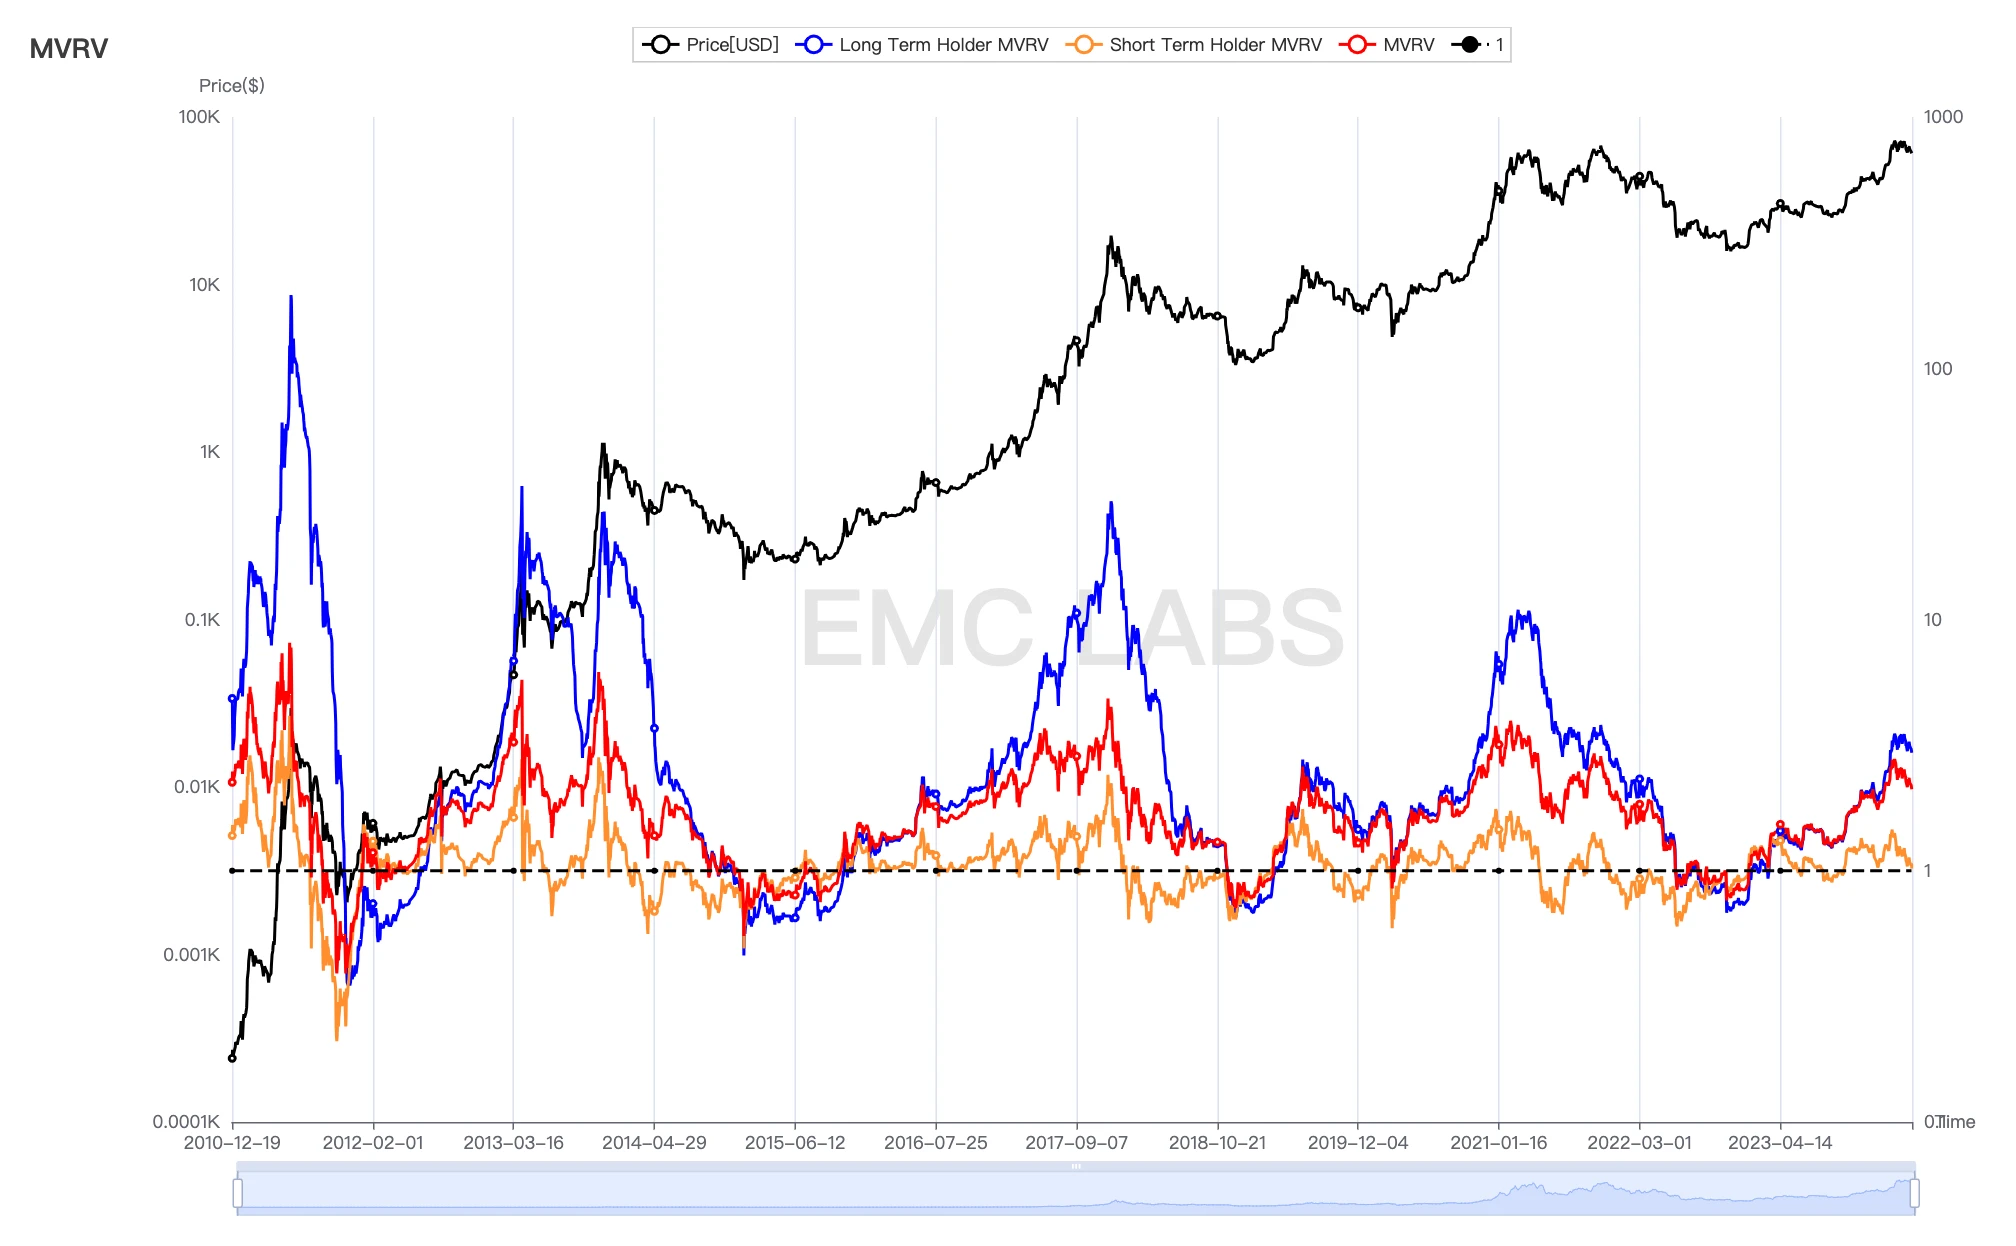
Long-short hand and the whole market floating profit and loss ratio
There are always drastic adjustments during a bull market, which objectively clears floating chips.
An indicator worth paying attention to is the short-hand MVRV (floating profit and loss ratio). During the repair and rising periods, as prices rise, the floating profits of coin holders increase. At this time, the market needs to use the decline to clear out those short-handed chips that have just joined the train and the long-handed chips with sufficient profits. Historically, this clearance often requires the price to fall to a position where the MVRV value of the short-hand group is close to 1 before it can stop. Since last year, this clearance has occurred twice, in June and August to October last year. In January, it fell to a minimum of 1.03. As of April 30, this cleaning has reached 1.02 (on May 1, MVRV fell to 0.98). It is worth noting that in history, after experiencing such severe tests, the price of BTC often ushered in a sharp rise.
Another scary guess is that this cycle is a front-runner, with a new high before the production cut, and the current bull market has already passed the top. One of the evidences is the VDD destruction indicator.
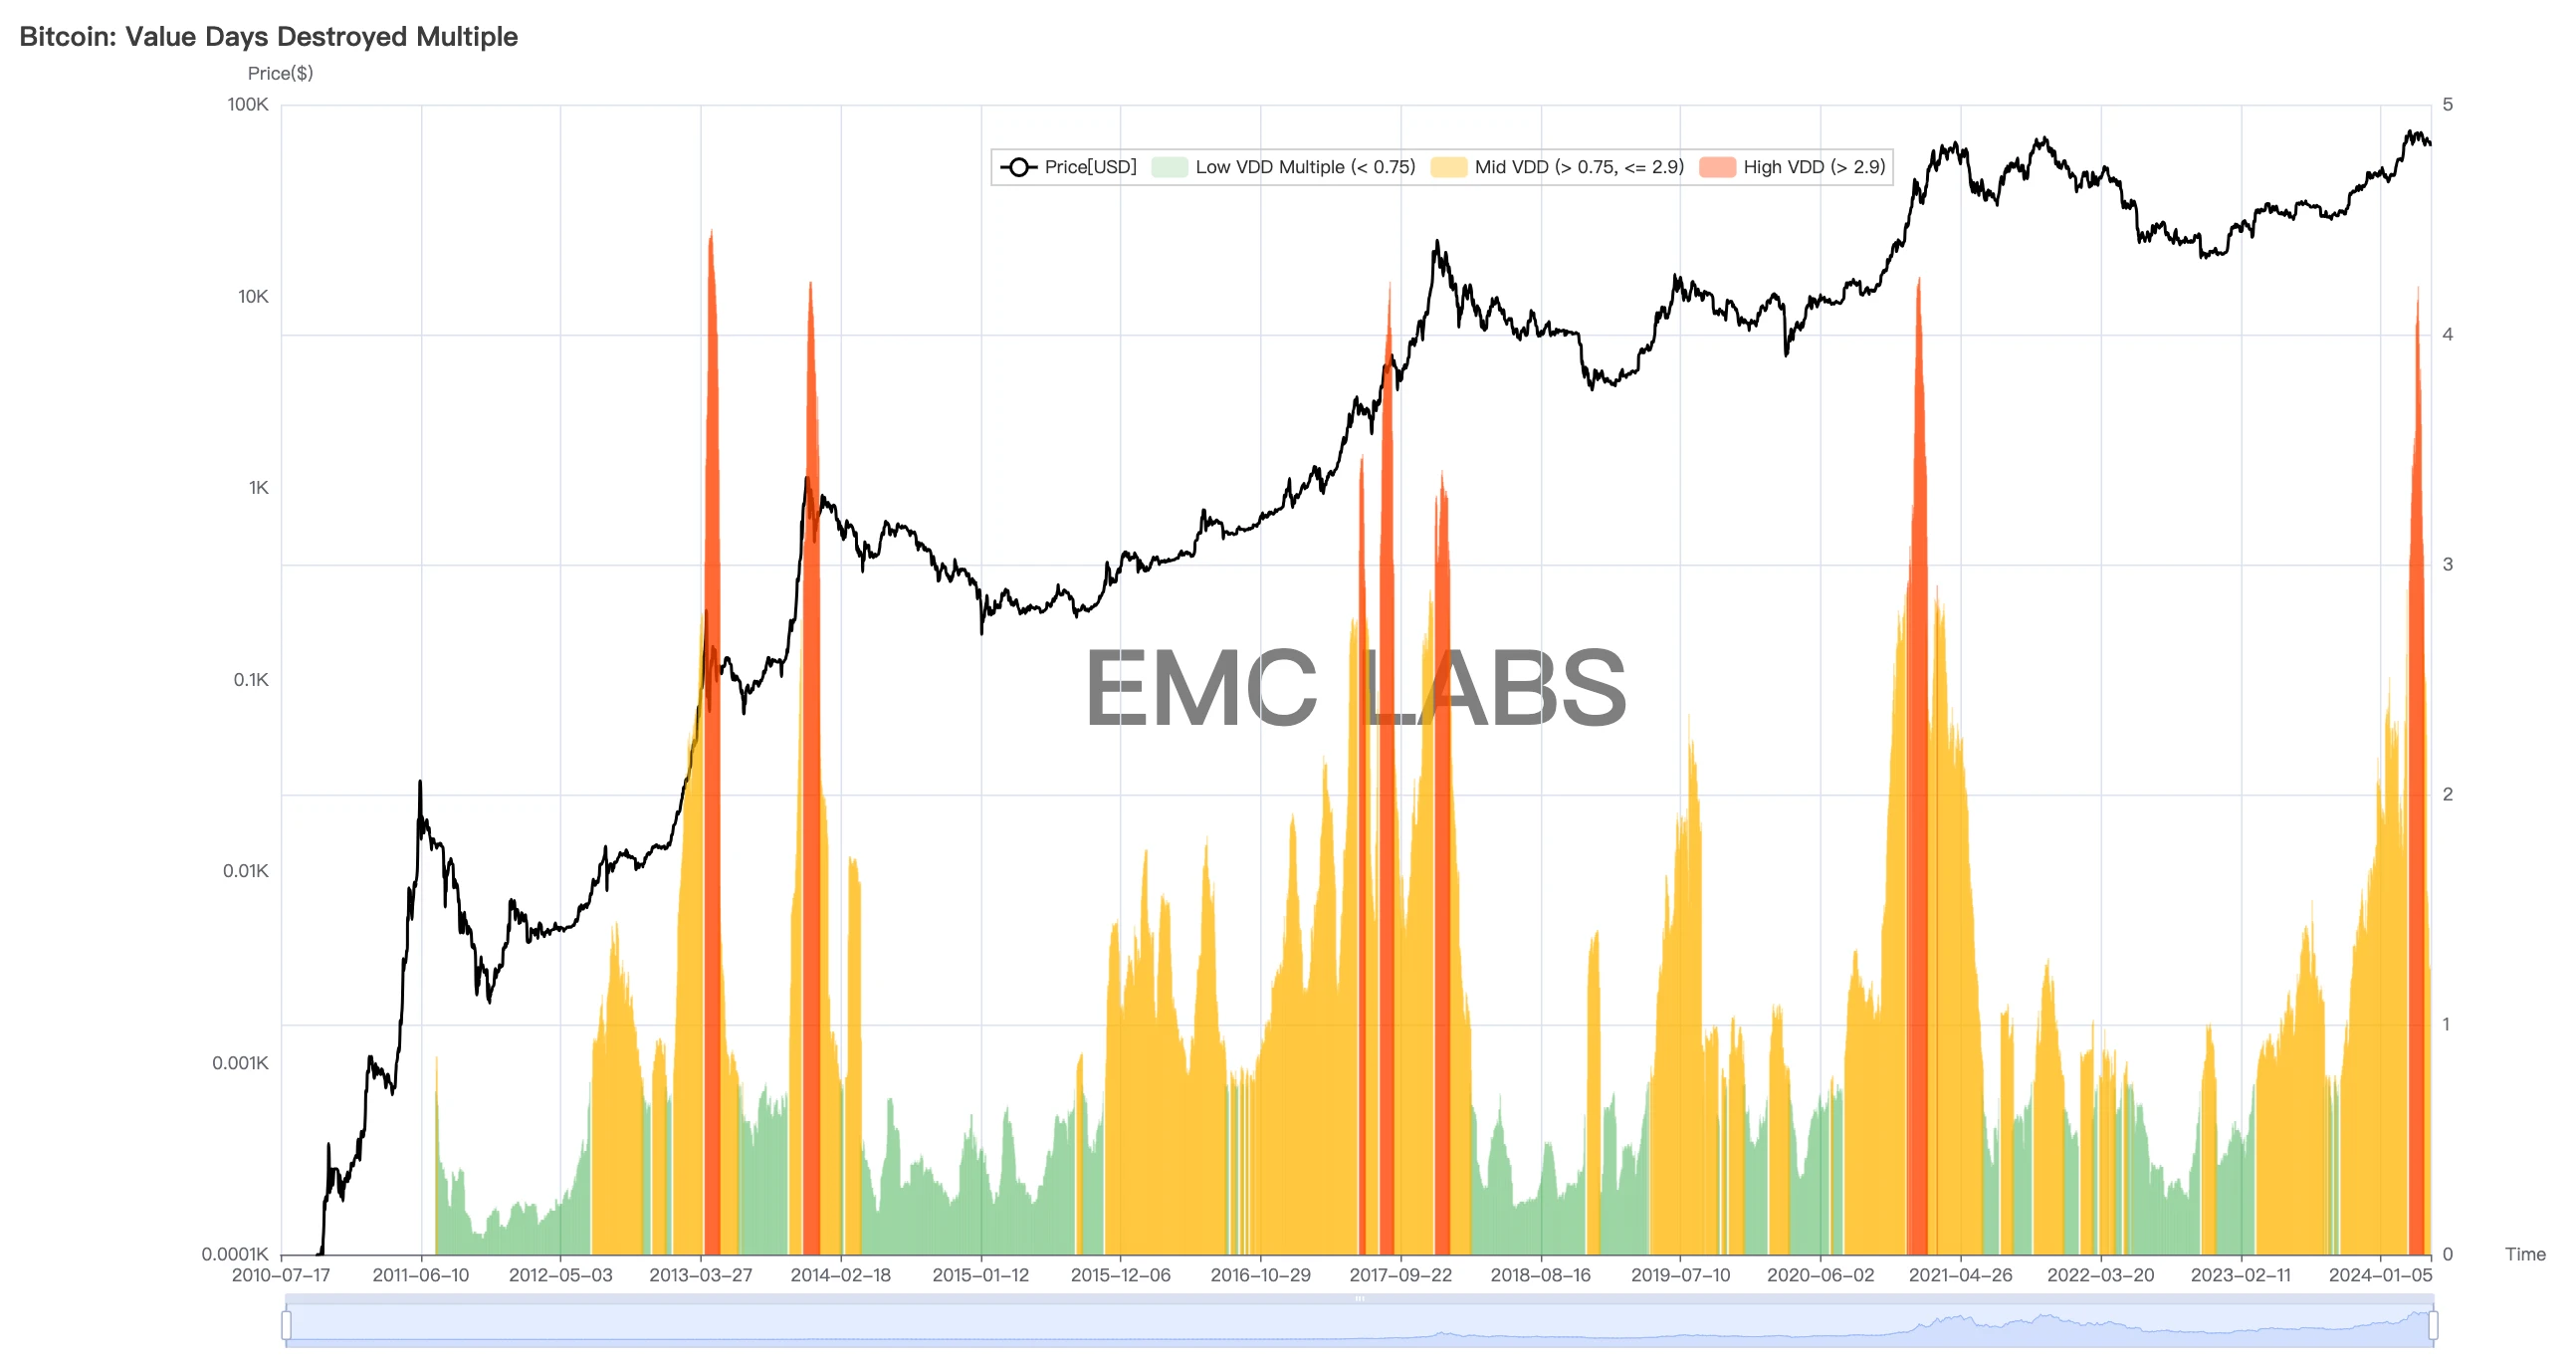
BTC VDD Destruction Data
The VDD destruction indicator not only takes into account the realization of value, but also takes into account the holding factors of long and short hands in the realized value, so it has great reference value.
The peak speculation is closer to the last bull market (2021). Another speculation based on this data is that the bull market is halfway through, and the bull market will end if there is one (similar to 2013) or two (similar to 2017) large-scale VDD destructions.
A major interference factor in this round of VDD data is the redemption of Crayscale Trust holdings after conversion to GBTC. This interference data can also affect the judgment of the scale of long-term selling.
Conclusion
Combining multiple aspects of fundamentals, capital, policy, market cycle and industry cycle, EMC Labs believes that the decline of BTC in April was the result of a weak balance between buyers and sellers after its price soared in July and some investors sold off heavily. New entrants chose to wait and see cautiously, while traders who traded based on macro-financial data and technical indicators dominated the market. The adjustment range was comparable to the scale of the previous bull market pullback.
Judging from the inflow of stablecoins (the second highest since last year), the markets enthusiasm for long positions has not been extinguished. The current adjustment is due to the fact that macro-financial and economic data exceeded expectations, causing the funds entering the market to hold on to the currency and wait and see. As such, macro-financial data, especially the Feds statement on interest rate cuts and changes in core economic data such as non-agricultural employment, will dominate the attitude of funds in the market for some time to come, and thus determine the price trend of BTC.
Currently, Bitcoin chain activity has declined significantly and has fallen close to the bear market level. User activity has shifted to Solana and Etherum, making the user data of these two networks still in an upward state. What is worrying is that the market currently expects that the interest rate cut has been postponed to after September. So in the next four months, what information will the funds and short positions on the market use to make trading decisions? The current balance is very fragile, and the decisions of the two will break the balance and push the market up or down violently.
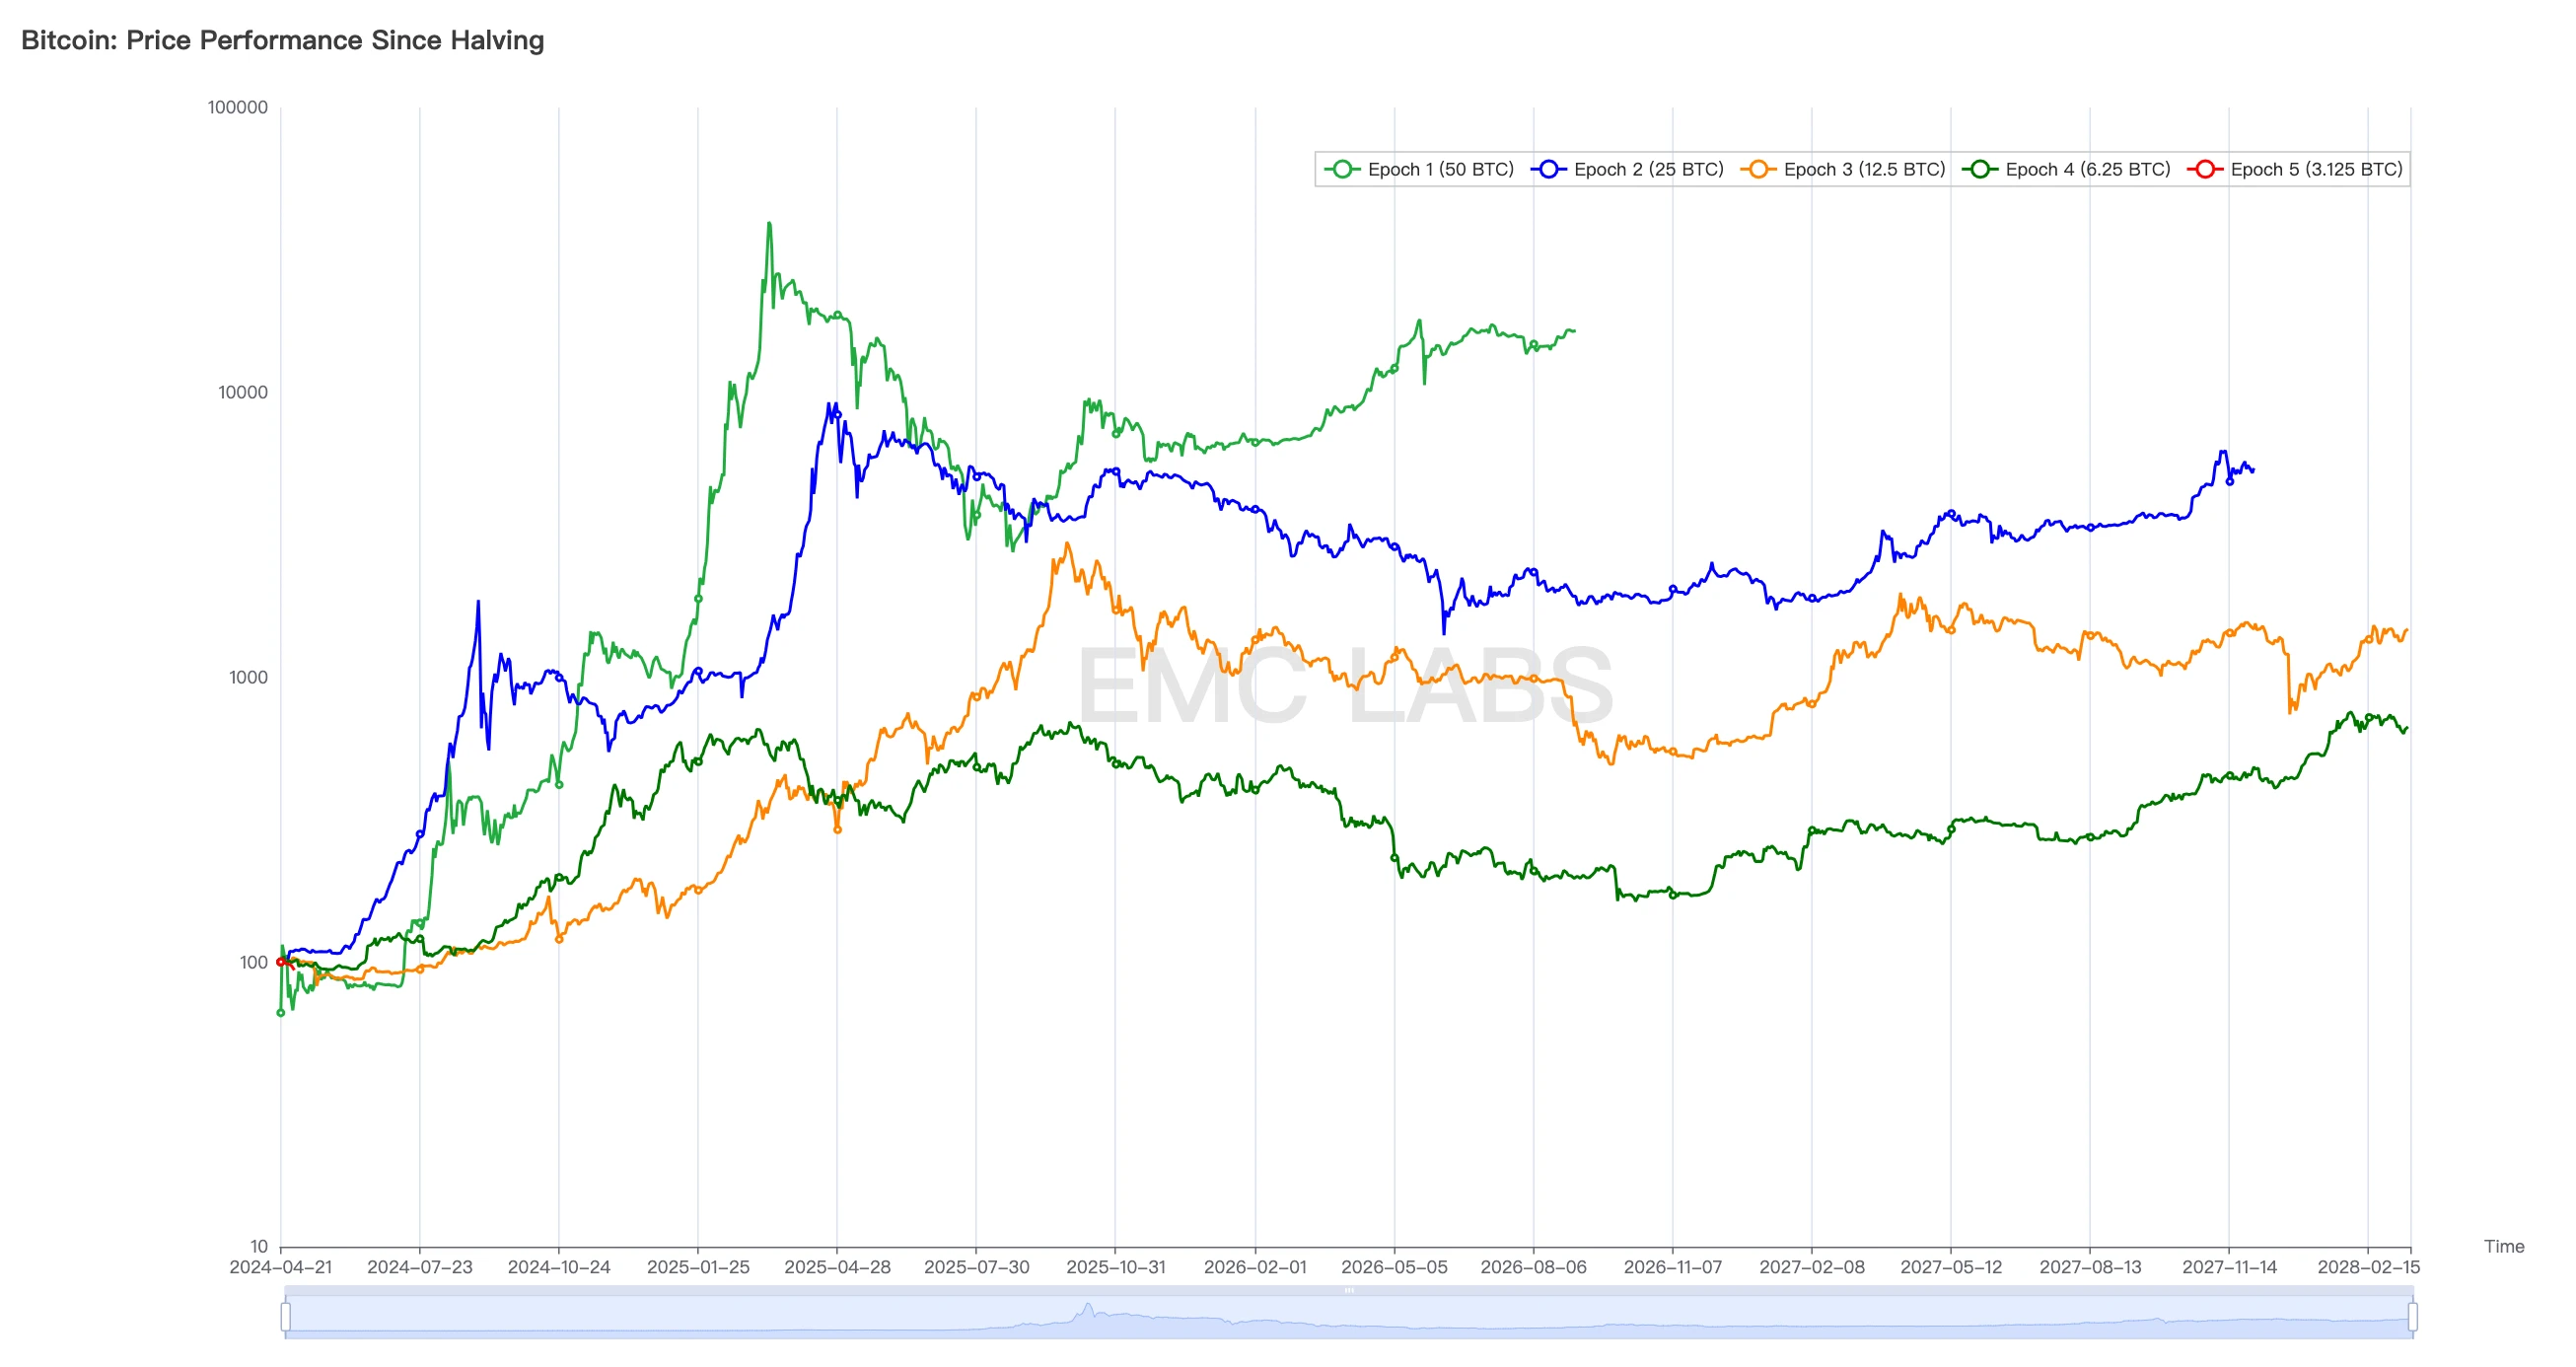
BTC price trends after each halving
If it goes upward, it will most likely start the second phase of the bull market and usher in the AltCoin Season.
If the trend goes downward, the confidence of coin holders will collapse, leading to a chain stampede. The AltCoin, which has already been halved, may break again.
This is the worst possible development with a very low probability.
END
EMC Labs was founded by crypto asset investors and data scientists in April 2023. It focuses on blockchain industry research and Crypto secondary market investment, takes industry foresight, insight and data mining as its core competitiveness, and is committed to participating in the booming blockchain industry through research and investment, and promoting blockchain and crypto assets to bring benefits to mankind.
For more information, please visit: https://www.emc.fund


