


Original article by Jasper De Maere, Outlier Ventures
Original translation: J1N , Techub News
Since March 2024, the cryptocurrency market has experienced a sharp correction. Most Altcoins (tokens other than Bitcoin, Ethereum, etc.), especially some relatively mainstream Altcoins, have seen their prices fall by more than 50% from their highs, but this has not had much impact on newly listed tokens. By studying more than 2,000 token issuance cases, we found that the prices of native tokens of early-stage projects with financing scales of millions of dollars can remain stable and move independently of the market.
Summary
In the private equity market of Web3, the investment scale of Pre-Seed and Seed rounds is around one million US dollars. At the same time, projects with a longer financing process will have a longer time interval to obtain the next round of financing and receive less financing amount.
Based on our observations of the market from January to April, we found that the investment and financing market reacts to the rise and fall of the broader market with a lag, that is, a large amount of investment and financing will only emerge one month after the broad market surges.
Public sales dominated the token issuance this year, accounting for 81% of all token issuances year-to-date. There is not even a track with more private placements than public sales, which shows that public sales are strongly favored by the market.
Because the valuation data of each stage varies greatly after the projects complete different stages of financing, and because these projects often have subjective biases when disclosing information, it is impossible to draw meaningful conclusions from them.
Financing scale and track maturity
Web3 itself is not an industry, but a technology stack that is changing the entire industry. At the same time, no two tracks in Web3 are the same. The backgrounds of the founders are different and the blockchain solutions provided by the projects are different. Therefore, each track in Web3 has different requirements for capital. In order to make everyone more clear about the capital needs of each track, we combined the financing scale with the financing stage of each track, with a time range of early 2024 to August 11, and then obtained a chart:
X-axis: the stage at which the project is financed.
Y-axis: average financing amount of the projects.
Bubble: The size of the bubble represents the number of financings for the project.
The diagonal line from the lower left to the upper right divides the yellow and blue areas. The blue area represents tracks with relatively less financing, and the yellow area represents capital-intensive tracks.

Financing stages and scales of each track in 2024
Token Financing
Based on data from the beginning of the year to August 11, we studied a total of 375 projects that either adopted a public-private hybrid token issuance model or used non-stablecoins for financing.
Throughout the past year, a total of 375 tokens were listed in the cryptocurrency market, of which 70 were privately funded and 305 were publicly funded. By making a chart of the number of tokens listed and the rise and fall of the Altcoin market value, we can see that the number of tokens listed and the increase in the Altcoin market value are positively correlated. When the Altcoin market value is on an upward trend, the number of tokens listed will rise sharply in the next month. In the past few months, due to many holidays and poor market performance, activities have decreased.
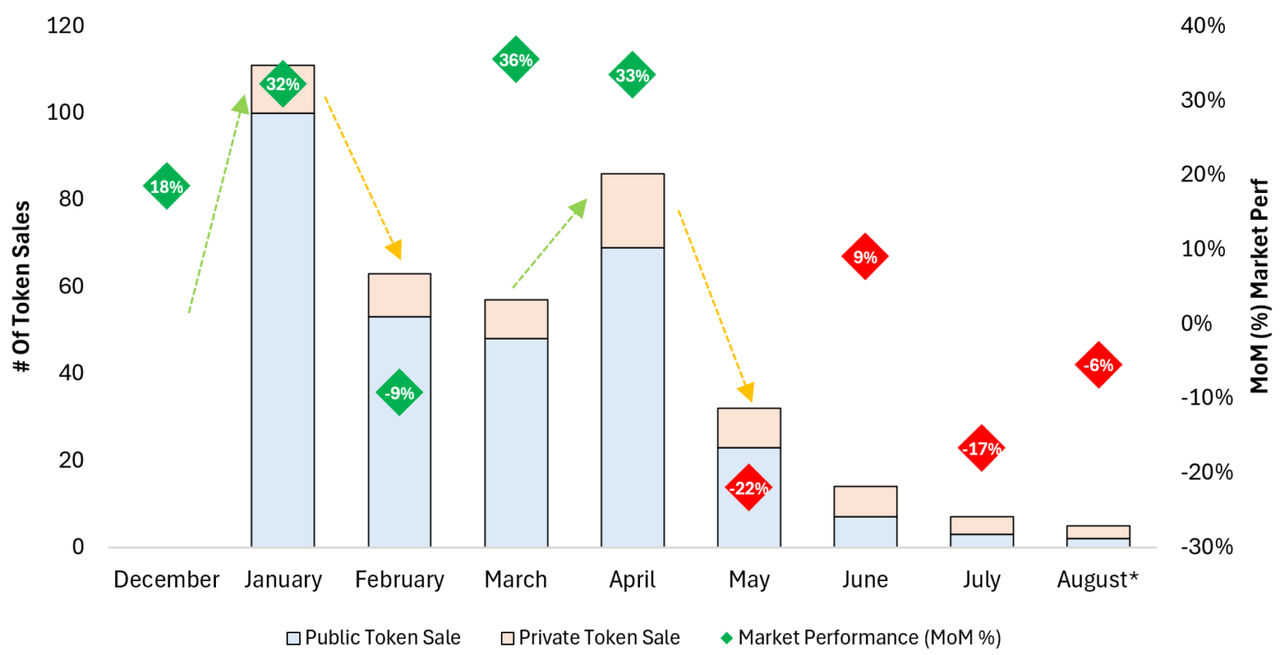
Comparison of the number of tokens listed and the rise and fall of Altcoin market value
Further observations show that not only is the number of tokens listed related to the rise and fall of Altcoin market capitalization, but also the number of tokens listed through private placements is positively correlated with the rise and fall of the market. We think this is expected, because public offerings usually require more preparation from the project side, and too long preparation time may lead to missing the market.
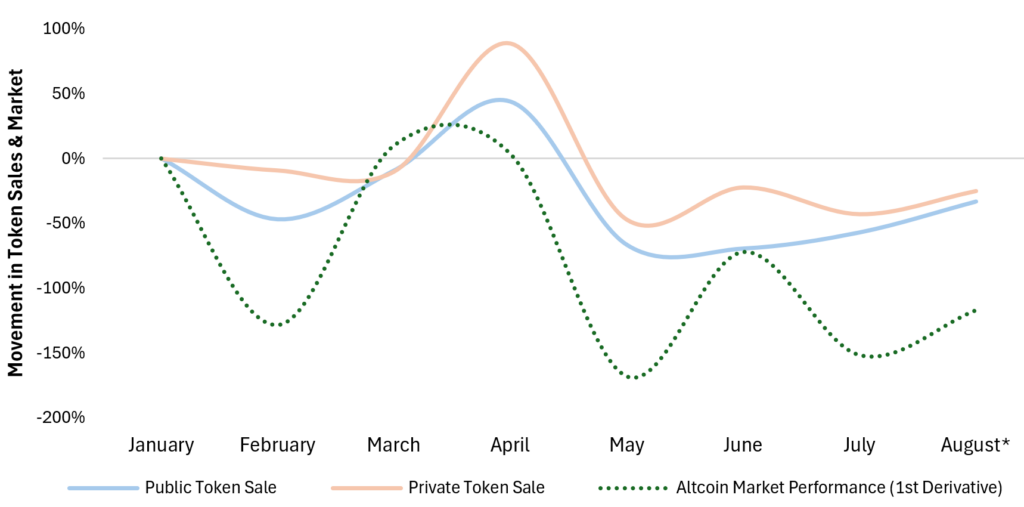
Number of token issuance events vs. monthly Altcoin market cap growth
We also analyzed the financing methods of projects. About 81% of the newly listed tokens were sold publicly. So far this year, no track has had more private placements than public sales.
On the X-axis, with the middle as the dividing line, you can see private placement on the left and public sale on the right. The Y-axis shows the median amount of financing, and the size of the bubble indicates the number of tokens listed.
There are 82 game projects, 44 exchange projects, 19 DeFi yield protocols, and 19 metaverse projects. These four tracks account for the majority of token issuance projects this year.
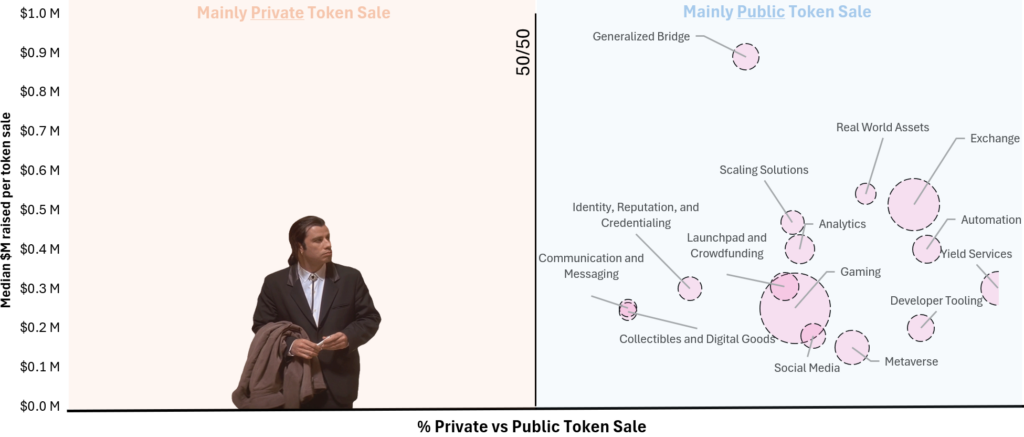
Relative share of public and private token sales and median funding amounts
Traditional venture capital
We studied 1,919 financings and analyzed the data at each financing stage. The conclusions we reached include:
Seed round is the most active funding stage, followed by accelerator and pre-seed rounds. As tokens are listed, the gap between pre-seed and seed rounds is narrowing.
As the cycle heats up, more and more ecosystems emerge and the number of projects incubated by accelerators increases.
From 2024 to the present, we have calculated the average financing size of each stage: US$2.2 million in the Pre-Seed round, US$4.9 million in the Seed round, US$19.8 million in the A round, and US$51 million in the B round.
Let’s take a closer look at these numbers. We found that Seed is the most active round of funding, followed by Pre-Seed. Interestingly, we found that fewer and fewer companies are distinguishing between these two rounds, as Seed is sometimes replaced by Private Equity.
Next, we noticed a lot of accelerator incubation programs. According to our observation, these incubation programs have increased compared to last year. This year we have seen the birth of many new accelerators in Web3. But there is a problem with the data, which is the number of grants. I think the actual number of incubation projects is an order of magnitude larger than the statistical number. Therefore, grants are not considered financing.
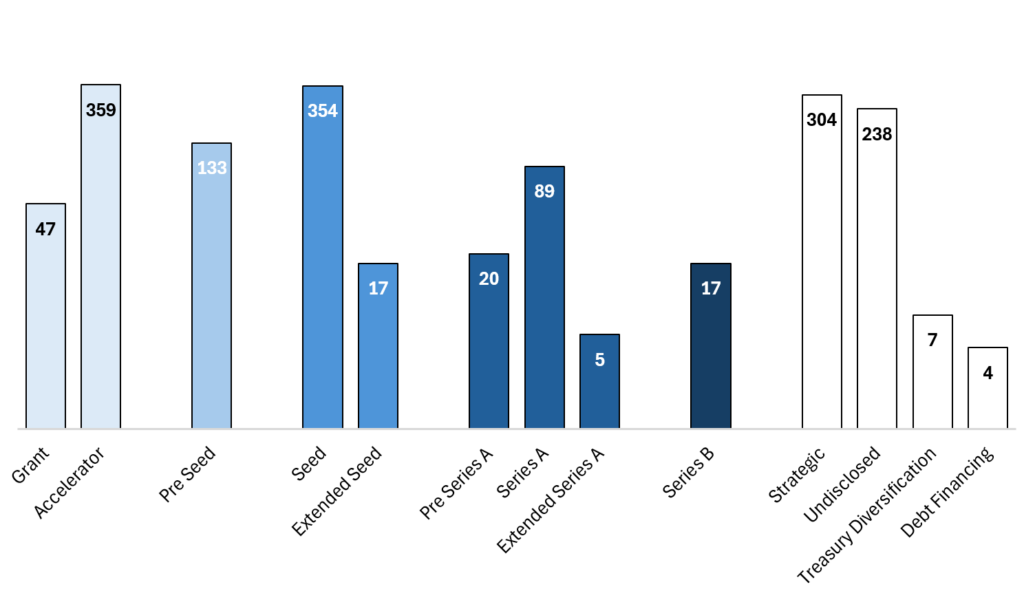
Different financing stages and amounts from the beginning of the year to date
Marking the financing amount data, we get the following figure. It is relatively common for project owners to choose not to disclose the financing amount, but if the data sample is large enough, the missing data can be inferred.
As shown below, the gray area is the extrapolated data. In order to eliminate the huge impact of outliers, we use a conservative method to calculate the total by mixing the median and the mean.
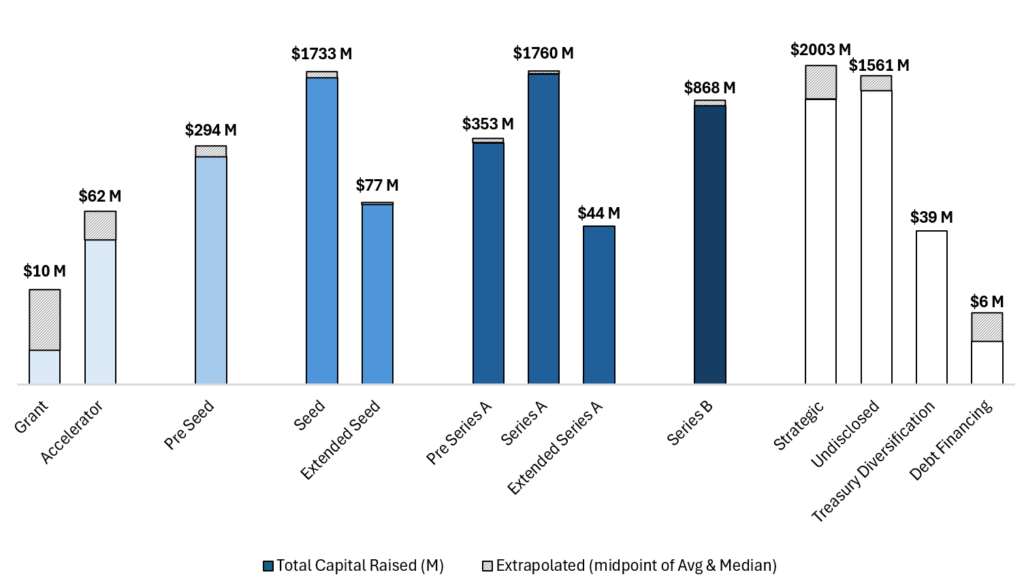
Total funds raised at different stages
Using the above two charts, we further calculated the approximate average financing amount at each stage from the beginning of the year to date, that is, simply dividing the number of financings by the total financing amount. Although the results are not accurate enough, they are consistent with the recommended analysis we provide to our peers.
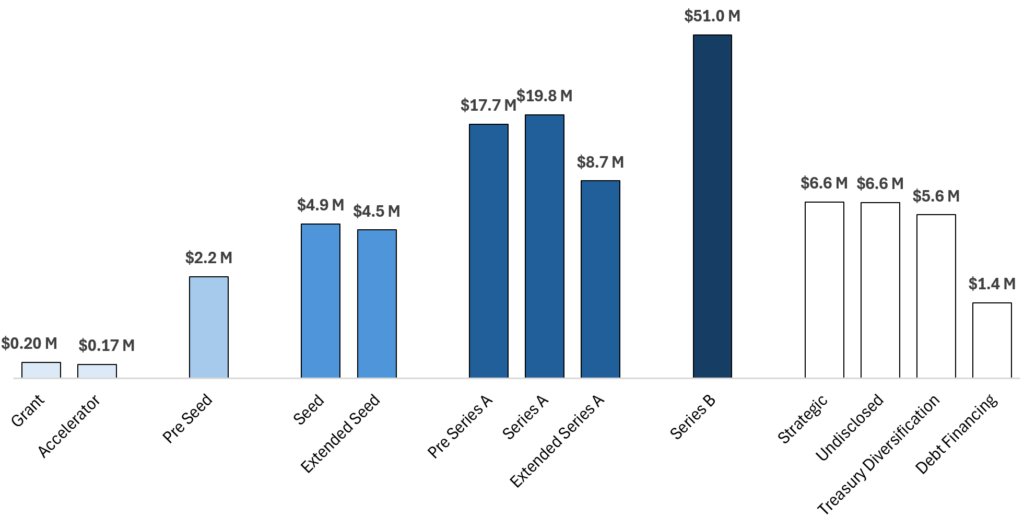
Average funding amount by deal stage
Finally, we studied the changes in the financing scale of Pre-Seed, Seed and Series A over time. From the data, it can be seen that despite the market turmoil, the scale of Pre-Seed and Seed rounds is less affected by the market because these early projects focus on innovative fields.
In contrast, Series A is closer to or at the TGE stage, requiring project parties to prove the attractiveness of their products. Market corrections usually have a greater impact on later-stage investments, leading to a decline in both financing activities and scale, as was the case in 2022.
The increase in early-stage financing this year (starting from January 2024) may be due to the fact that investors believe that the market has entered a new cycle from the late stage of turbulence to the early stages of recovery, so the investment and financing market was booming at the beginning of the year.
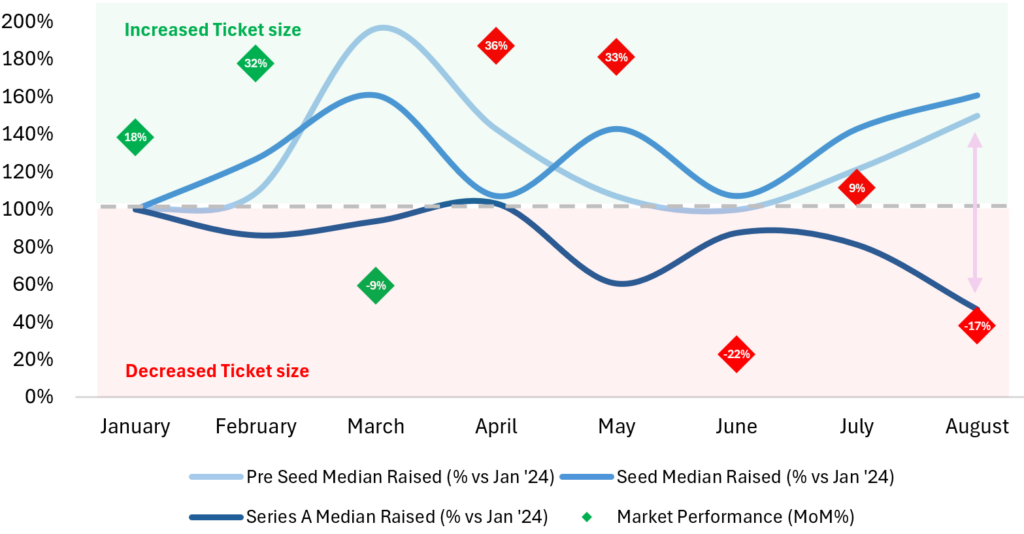
Compared with January, the change of financing scale in each stage
Data Adjustment
Key Information:
Token listings are usually done in tandem with seed, Series A, and strategic rounds of funding.
The most common financing combination in a short period of time is accelerator + seed round. Many people complete new financing when they join a new project program or soon after joining the project.
We report all funding data for the cryptocurrency industry from the beginning of 2024 to date. However, there are some problems in the process of collecting data, which are explained below.
In our data, 1,392 companies register their financing information in multiple channels at the same time. There are two situations:
The company completed multiple rounds of financing within a year.
The company conducted both traditional venture capital and on-chain token financing.
Here are some of the most common funding combinations. The most common is accelerator and seed rounds, which makes sense because accelerator incubation programs help reduce the risk of project business models, and projects often choose to join accelerators when preparing for Pre-Seed or Seed rounds. We also see public token sale rounds and strategic or seed rounds at the same time, often before or at the launch of the launch and TGE. In addition, only four companies completed both seed and A rounds this year.
Various financing options and the number of them adopted
We highlight these trends to show project founders that non-traditional financing structures are not uncommon, and we strongly recommend that founders combine traditional equity and token financing.


