


4 Alpha Core Views
1. Macroeconomic Review of This Week
1. Market correction expectations, defensive sentiment dominates
• US stocks generally retreated, but the utilities sector rose against the trend, and funds flowed into defensive assets.
• VIX remains above 20, and market sentiment is still in a cautious adjustment phase.
2. Commodity markets diverge, risk aversion rises
• Gold price broke through $3,000/ounce to a new high and copper price rose 3.9%, indicating that the manufacturing industry is still supported by demand.
• Crude oil prices were stable, but net futures positions fell, reflecting market concerns about global demand growth.
3. The crypto market is adjusting synchronously, and BTC still has long-term allocation value
• BTC’s short-term selling pressure eases and will be supported by the liquidity environment in the long term.
•Altcoins performed weakly, market risk appetite declined, and stablecoin capital inflows slowed down.
4. Tariff impact emerges, and global supply chain accelerates adjustment
• The BDI rose, indicating a pick-up in manufacturing activity in Asia and Europe, while the US transport index fell, pointing to weak domestic demand.
• There is a clear trend of supply chain restructuring, and the US domestic economy is under pressure.
5. Inflation data cools down, but inflation expectations diverge
• CPI and PPI were lower than expected, reinforcing market expectations for rate cuts, but consumer inflation expectations rose, with clear partisan differences.
• Divergence between actual data and expectations increases market uncertainty.
6. Liquidity is marginally loose, but credit market risks are intensifying
• TGA account outflows, the use of the Feds discount window declined, and liquidity was temporarily stable.
• Widening credit spreads, rising CDS, and intensifying market concerns over corporate and government debt may suppress the performance of risky assets.
2. Macroeconomic Outlook for Next Week
1. Key market variables next week: FOMC meeting, retail data, global central bank dynamics
• Pay attention to the Fed’s dot plot’s guidance on rate cuts (2-3 rate cuts expected).
• Whether QT will be suspended will become the market focus and may affect market risk appetite.
2. Strategic recommendations
U.S. stocks: Reduce high-beta assets, increase holdings of defensive sectors, and pay attention to opportunities for missed sales.
Crypto market: Hold BTC for the long term, reduce altcoin allocation, and observe stablecoin liquidity.
Credit market: Reduce highly leveraged corporate bonds, increase high-rated bonds, and be wary of U.S. debt deficit risks.
Core turning point signal: credit market recovery or FOMC releasing clearer easing signals.
4 Alpha Macro Weekly Report: When will the turning point come? How to interpret the signals from the credit market?
1. Macroeconomic Review of This Week
1. Market Overview
As we pointed out in last weeks market weekly report, the current market is still in the stage of multiple expectations game . This week, judging from the specific performance of the US stock, cryptocurrency and commodity markets , the core trading logic of the market is still centered around the adjustment of the Feds interest rate cut expectations and the slowdown of US economic growth , and investors pricing of risky assets has entered a phased adjustment.
US stocks: Defensive assets are favored, and the market corrects the previous optimistic sentiment. This week, the three major US stock indexes have significantly corrected , including:
• Dow Jones Industrial Average (-3.1%),
• Nasdaq (-2.6%),
• Russell 2000 Index (-1.8%)
The overall risk appetite of the market has declined. It is worth noting that the utilities sector (+1.4%) has become the only sector to rise, reflecting that funds are shifting to defensive assets. In addition, the VIX volatility index remains above 20, but has not entered the extreme panic range, indicating that market sentiment is more of a correction of previous excessive optimism rather than an accelerated release of pessimism.
Commodity markets: Gold hits record high, copper prices rise, and energy markets diverge.
This week, gold broke through $3,000/ounce, setting a new record high, reflecting the continued strengthening of market demand for safe-haven assets. At the same time, copper prices rose by 3.9%, indicating that the market still has certain support from manufacturing demand. However, the energy market showed differentiation:
• Crude oil prices stabilized around $67 , but CFTC futures net positions fell by more than 9.6% , suggesting that market expectations for global demand growth remain weak.
• Natural gas prices continued to fall, mainly due to oversupply and weak industrial demand .
Cryptocurrency market: Volatility converges, risk appetite declines.
The cryptocurrency market as a whole is still in a state of adjustment in sync with the U.S. stock market. Although Bitcoin is still on a downward trend on a weekly basis, the amplitude has narrowed, indicating that short-term selling pressure has eased. However, at the altcoin level, ETH, SOL, etc. are still weak , indicating that the market risk appetite has decreased. In addition, the market value of stablecoins continues to grow, but the net inflow slows down , suggesting that market liquidity has become cautious and the speed of incremental funds entering the market has slowed down.
Judging from the data in recent weeks, the impact of tariffs has gradually emerged, accompanied by adjustments in global supply chains and cooling of US demand.
Trumps new round of tariff policies not only impacted the expected pricing of risky assets, but also began to play a role in the real economy . This weeks transportation market data further confirmed this trend:
• The Baltic Dry Index (BDI) continues to soar , indicating strong demand for shipping in Asia and Europe and that manufacturing capacity may be shifting overseas at an accelerated pace.
• The U.S. transportation industry index (-6.5%) showed a significant decline , suggesting weak domestic demand and declining domestic logistics demand.
This divergence reflects that under the influence of tariff policies, the global supply chain is undergoing regional restructuring - domestic demand in the United States is slowing down, while manufacturing and export activities in Asia and Europe may be relatively active. At the same time, the rise in copper prices and the stability of crude oil prices further illustrate that the market still has differences in pricing for economic recession . Although macroeconomic data has not yet clearly supported the judgment of recession, the uncertainty of future demand prospects remains high.
2. Economic data analysis
Last week, several important data were mainly CPI, PPI and inflation expectations.
The NFIB Small Business Confidence Index for February, released on Tuesday, fell for three consecutive months, indicating that concerns among small and medium-sized enterprises in the United States about trade policy uncertainty continue to worsen.
The CPI data released on Wednesday was better than market expectations. The seasonally adjusted overall CPI and core CPI were both 0.2%, lower than the market expectation of 0.3%. Under the influence of these two data, the overall CPI year-on-year rate fell to 2.8%. The release of the data had a short-term boost to the markets risk appetite.
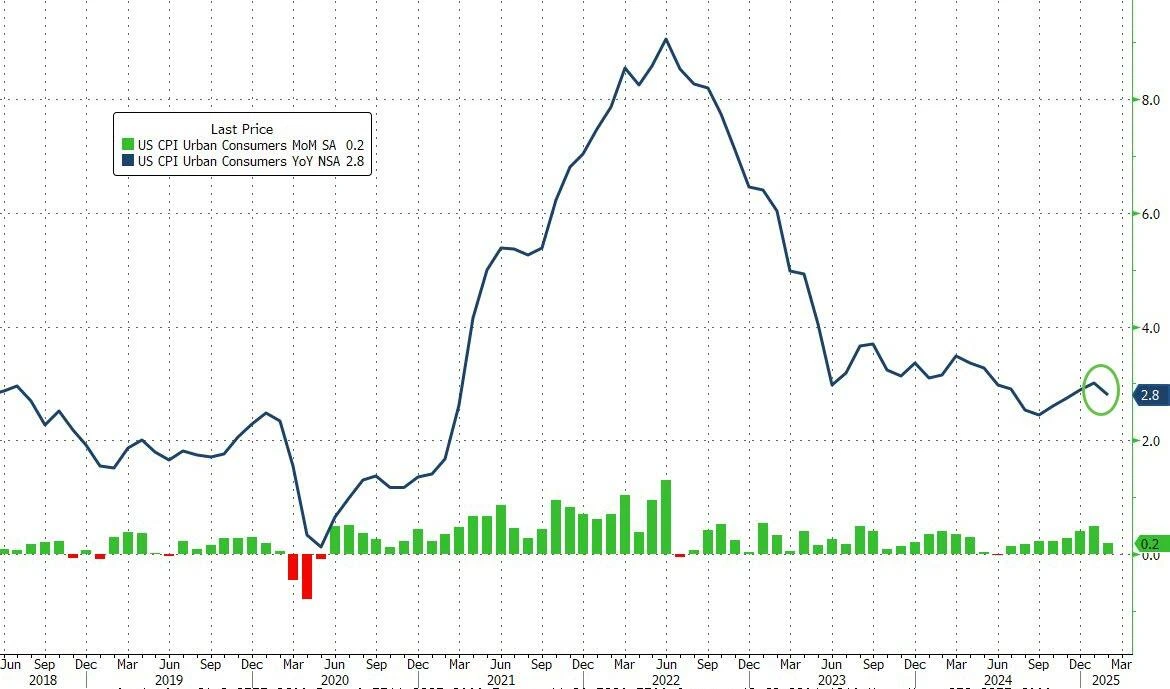
Figure 1: US CPI annual rate change Source: Bloomberg
Looking at the detailed data, although commodity inflation has rebounded, service inflation continued to be on a downward trend, and service inflation excluding housing fell to the lowest level since October 2023.
The PPI data released on Thursday continued the downward trend, with the core PPI falling by 0.1% month-on-month, the largest since April 202, and expected to rise by 0.3%. Among them, transportation services were the core contribution to the decline in PPI.
The University of Michigan Consumer Confidence Index and one-year inflation expectations released on Friday showed the opposite direction of the actual data. The initial value of one-year, five-year to ten-year inflation expectations (+3.9%, expected 3.4%) continued to soar. However, the data continued the previous partisan division, with different expectations according to party divisions. The surge in inflation expectations mainly came from Democrats. In fact, the obvious difference in party data has turned this data into market noise.
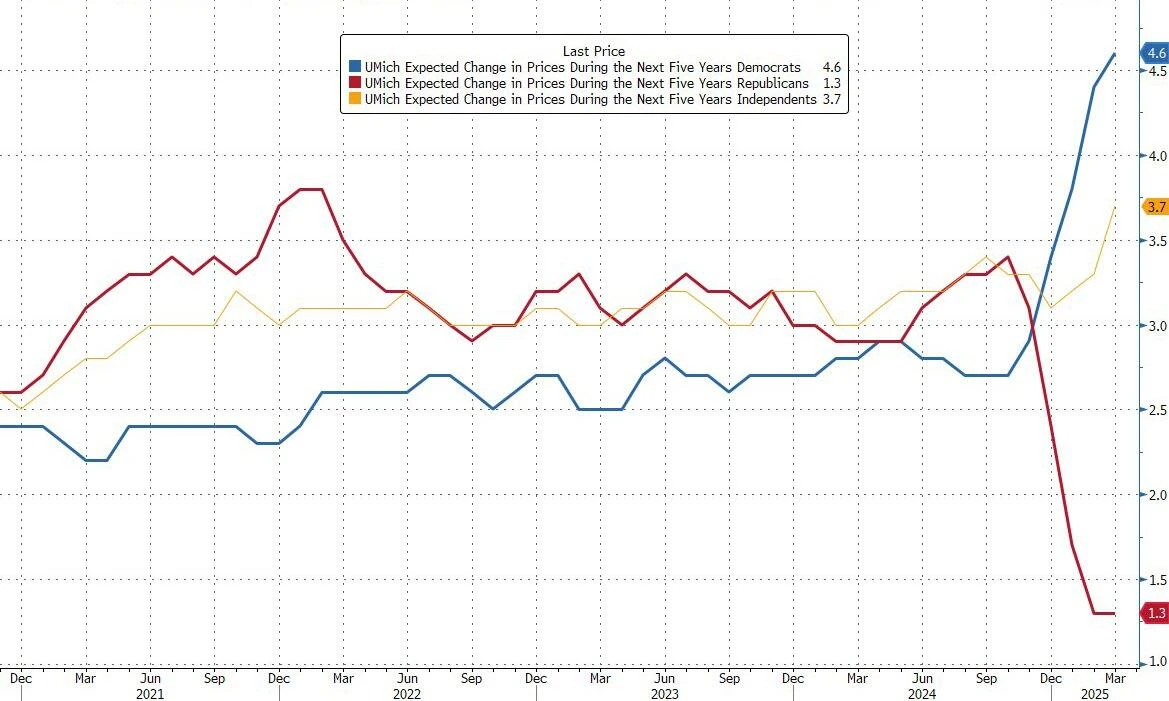
Figure 2: University of Michigan Inflation Expectations Survey Shows Clear Partisan Differences Source: Bloomberg
The CPI, PPI and inflation expectations data released this week showed dual signals of cooling of actual inflation and divergence of inflation expectations, which had a complex impact on market sentiment.
Overall, the decline in actual inflation data has strengthened the markets expectations for the Federal Reserve to cut interest rates this year, but fluctuations in inflation expectations have increased market uncertainty and intensified short-term market adjustment pressure.
3. Changes in liquidity and interest rate markets
From the perspective of broad liquidity (from the perspective of the Federal Reserves balance sheet), there has been a clear trend of marginal recovery in liquidity in the past two weeks, and this week it continued to remain above 6 trillion, mainly due to outflows from the U.S. Treasurys TGA account; in addition, the use of the Federal Reserves discount window continued to decline this week, indicating that the current macro liquidity is generally stabilizing.
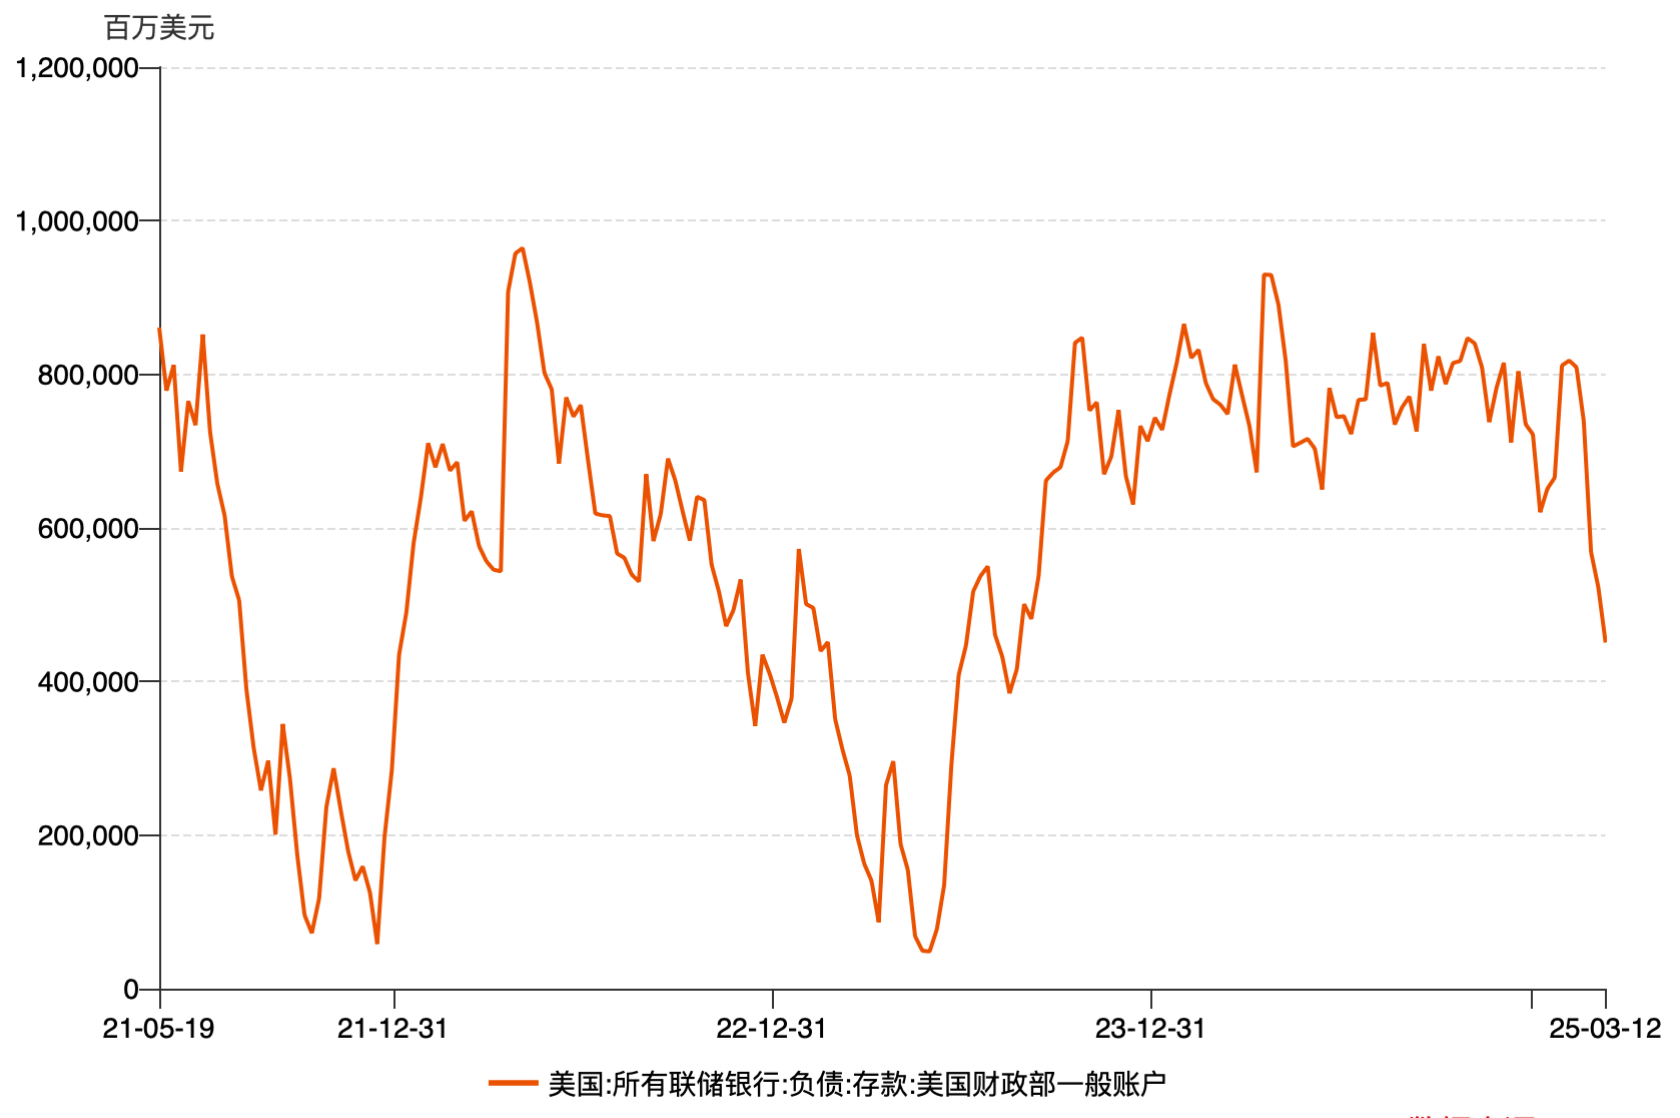
Figure 3: Changes in the balance of the U.S. Treasurys general account Source: Wind
From the perspective of the interest rate market, the federal funds futures market has almost priced in a very low probability of a rate cut in March, which basically means that the interest rate market does not believe that the Federal Reserve will take interest rate cut measures in March.
![]()
Chart 4: Federal Funds Futures Source: MacroMicro
However, the 6-month term interest rate and the Treasury yield curve suggest that the rate cuts this year will still be around 2-3 times. In the past period of time, the short-term yield has fallen sharply, while the long-term has been relatively stable, indicating that the market is gradually pricing in the Feds future rate cuts.
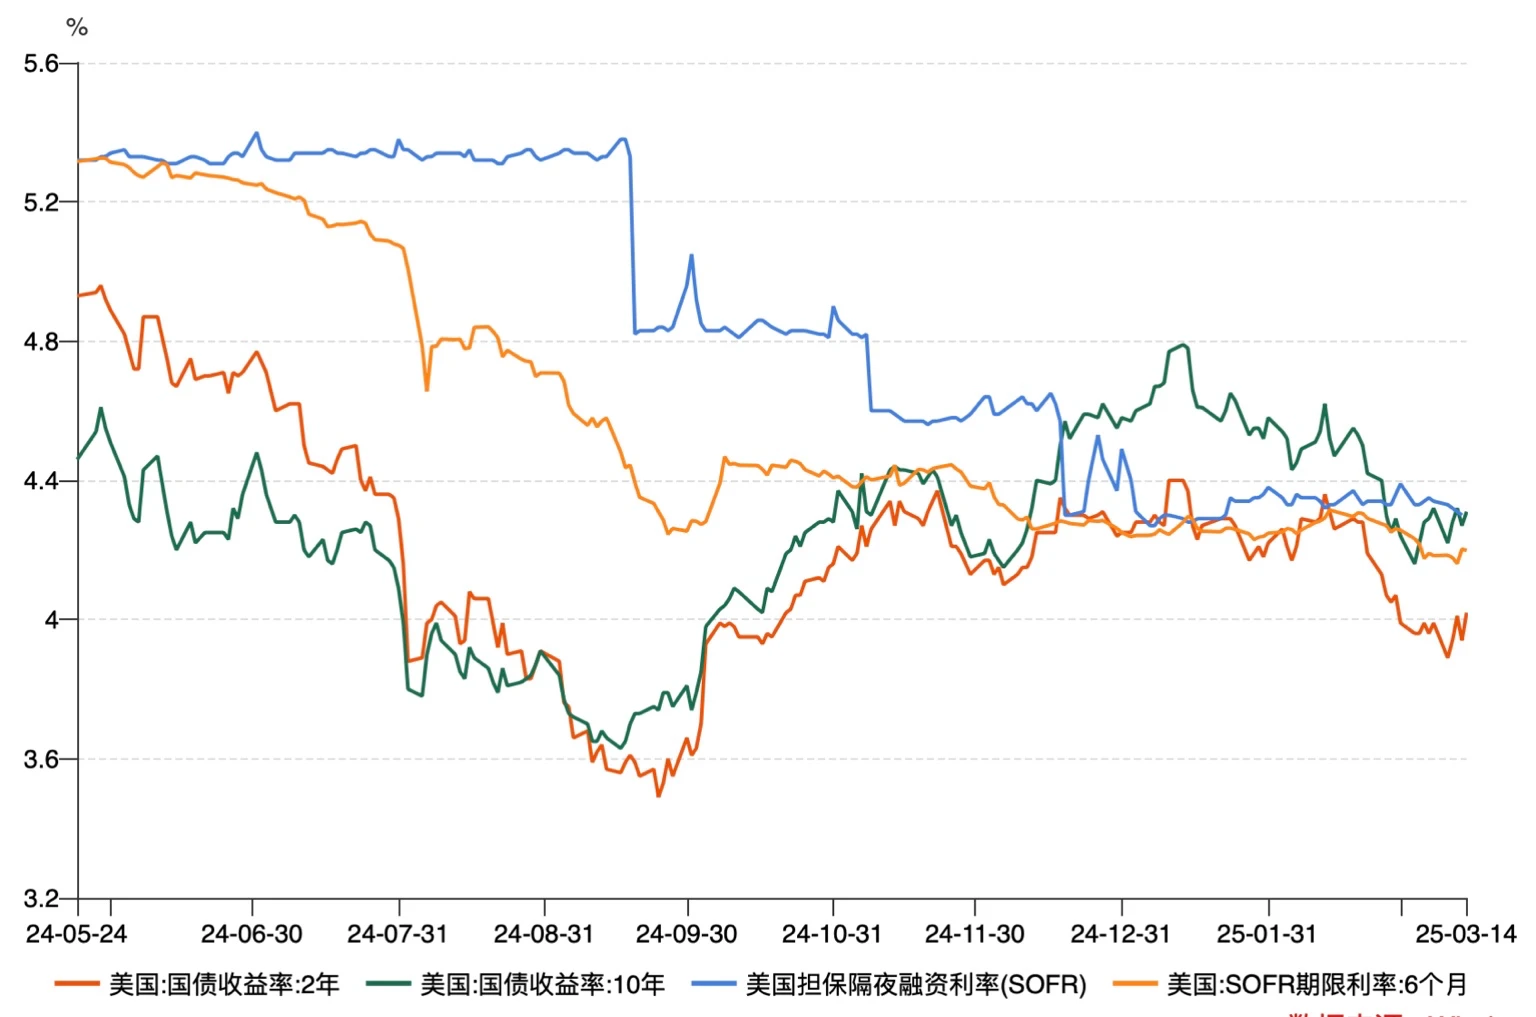
Figure 5: Treasury yields and SOFR interest rate performance Source: Wind
Another thing worth noting is the changes in the US credit market. In the past two weeks, corporate credit spreads have been widening. The North American investment-grade credit default swap (CDX IG) read 55.28 on Friday, up more than 7% this week. At the same time, US sovereign CDS and high-yield bond credit default swaps have both risen to varying degrees.
The widening of sovereign and corporate credit default swap spreads shows that: on the one hand, the markets concerns about US debt, including the sustainability of fiscal deficits, have increased, while concerns about corporate credit risks have also risen simultaneously. These factors will gradually be transmitted to the capital market, further suppressing the markets upward trend.
2. Macroeconomic Outlook for Next Week
The current market is in a period of triple contradictions: inflation cooling but expectations rising, credit risk rising but the economy has not yet declined, and liquidity marginal easing but policy restrictions. Market sentiment has not yet escaped the panic zone, and the uncertainty of Trumps tariffs still puts great pressure on the formation of market expectations for stability. In addition, in this weeks weekly report, we especially remind investors to pay attention to the credit market. The credit market is an important forward-looking indicator of risky assets. It directly reflects the markets confidence in the debt repayment ability of enterprises and governments. Changes in the credit market often precede the stock market or other risky asset markets, and its turning point often indicates changes in risk preferences.
Based on the above analysis, our overall view is:
1) Global stock markets: Focus on defense and pay attention to opportunities for missed opportunities.
As for US stocks, the market is still in the stage of expectation adjustment, and it is necessary to reduce the allocation of high-β assets and increase defensive sectors (such as utilities, medical care, and consumer staples) to cope with market fluctuations. At the same time, the high VIX index shows that the market is still in a cautious mood, so in the short term, we should avoid over-betting on high-growth, high-volatility sectors such as technology stocks and small-cap stocks.
Pay attention to opportunities for missed sales: A decline in market sentiment often leads to irrational selling. It is recommended to pay attention to blue-chip stocks with high dividends and stable cash flow, especially leading companies with global competitiveness and falling valuations. Such assets may be the first to recover after market sentiment stabilizes.
Appropriately increase allocation to the Asia-Europe market: As the effects of tariff policies gradually emerge, global supply chain adjustments are accelerating, and export and manufacturing activities in the Asia-Europe market are relatively more active. It is recommended to increase asset allocation in the Asia-Pacific region (especially China, India, and Southeast Asia) and the European market to hedge against uncertainties in the U.S. market.
2) Cryptocurrency market: BTC still has long-term allocation value, reducing the risk of altcoins
Bitcoin (BTC) has eased short-term selling pressure and is still supported in the long term. Although BTC still showed a downward trend last week, the amplitude narrowed, indicating that the panic selling in the market has weakened. From a macro perspective, the marginal recovery of liquidity and the unchanged trend of capital inflows provide long-term support for BTC, so it can continue to be held or increased on dips.
Reduce altcoin allocation. Market risk appetite is reduced. Funds are still mainly concentrated in BTC. Other crypto assets may continue to be under pressure in the short term. It is recommended to reduce risk exposure and maintain a wait-and-see attitude.
Pay attention to the flow of stablecoin funds. The slowdown in the growth of stablecoin market value indicates that the pace of incremental capital inflows has slowed down. We need to further observe the market liquidity situation to determine the direction of the next stage of the crypto market.
3) Credit market: Beware of widening credit spreads and possible intensification of debt risks
Credit spreads widened and market risk appetite declined. North American investment-grade credit default swaps (CDX IG) rose by more than 7% last week, and U.S. sovereign CDS and high-yield credit default swaps expanded simultaneously, reflecting the markets rising concerns about corporate and government debt.
Avoid highly leveraged corporate bonds and increase the allocation of high-rated bonds. As credit risk rises, highly leveraged companies may face greater debt repayment pressure. It is recommended to reduce the allocation of low-rated corporate bonds and turn to investment-grade bonds or U.S. medium- and long-term Treasury bonds to reduce credit risk exposure.
Be wary of the impact of the US debt deficit problem. The rise in sovereign credit default swaps (CDS) means that the market is increasingly concerned about the sustainability of US debt. If the deficit problem continues to worsen, it may further push up market risk aversion, thereby affecting the performance of overall risk assets.
Overall, the market is still looking for a new balance point. Investors need to remain cautious and seize potential opportunities to buy high-quality assets when the market overshoots.
The key macro data for next week are as follows:
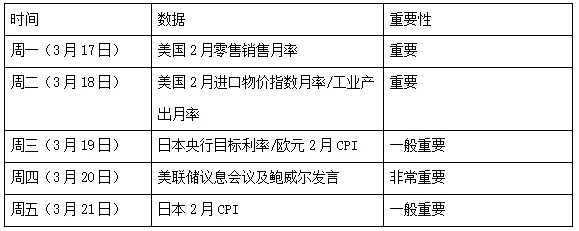
It is worth mentioning that the main key points of the market game at the FOMC meeting next week are whether the dot plot gives an expectation of 2/3 rate cuts and the tendency of Powells speech. In addition, another thing worth paying attention to is whether the Fed will announce a suspension of QT at this meeting. According to the current market liquidity situation and the reserves of the banking system, the suspension of QT may be expected, which will greatly boost the current market.


