


Key indicators: (March 10th 4pm -> March 17th 4pm Hong Kong time)
BTC/USD rose 1.5% (82.3k USD -> 83.5k USD), ETH/USD fell 8.2% (2.07 -> 1.9k USD)
BTC to USD spot technical indicators at a glance
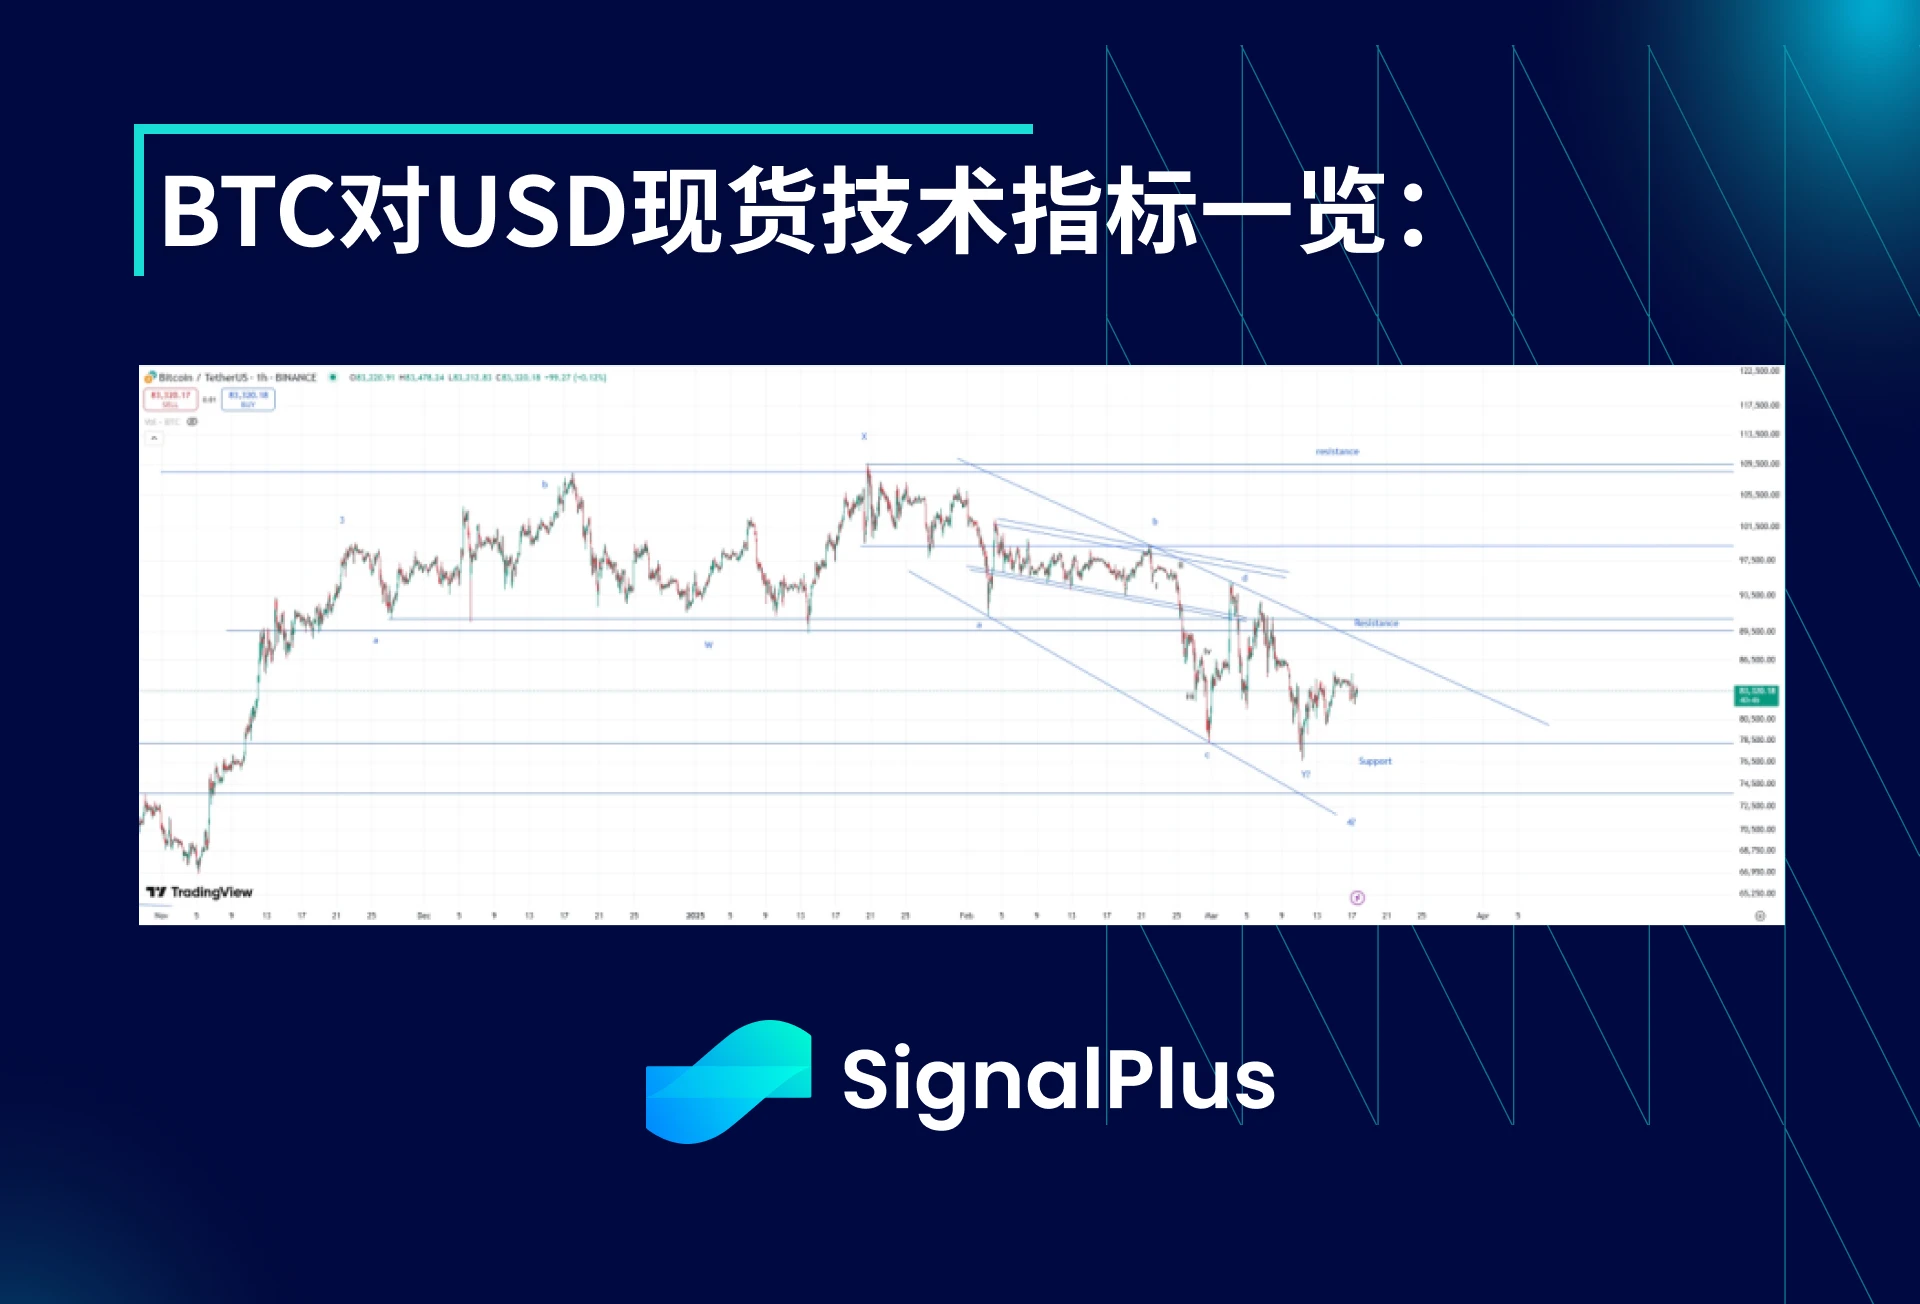
The spot price of Bitcoin has continued to fall over the past week, but as the price stabilizes in the $80-85k range, we are finally seeing realized volatility begin to return to a lower level. It is worth noting that the price hit a recent low last week, and the market has been closely watching the price movement in the following days, trying to guess whether the next big move will be up or down. Considering that we have experienced a long period of high volatility, we believe that the price will undergo some fine-tuning and stabilization in the future. It is expected that the support level will be $78-80k in the next week or so, and the nearest resistance level will be $85-86k, and then $89.5-92k.
If the price falls below $78k-80k, the market may return to a high volatility range. On the contrary, if it breaks through $92k, we will start to test the more meaningful long-term resistance level of $98k-100k again. We are optimistic about the medium-term trend of Bitcoin, but are still waiting for more signs to confirm the end of the correction cycle.
Market Theme
Another week of pretty volatile trading. SP 500 hits new lows amid ongoing equity fund long/short rebalancing and deleveraging. Rumor has it that there has been a massive pullback across multiple asset means, but there is nothing new on a narrative level to support this news. Markets are starting to get numb to the back and forth of tariffs, and ultimately this is just a long overdue correction and deleveraging, but the market has been optimistically ignoring this risk for years. Structurally, volatility is gradually showing up in this cycle, and the VIX is unlikely to stay in the teens for the next few months. Of course, there will be periods of calm and stability in between.
As for cryptocurrencies, Bitcoin fell below $80,000 several times last week as the market continued to clean up excess positions. Meanwhile, Ethereum fell below the key support of $2,000 and has not been able to regain its upward momentum since then. Bitcoin performed better than the SP 500 and Nasdaq during the week, but it was still heavy in the New York session and then bottomed out in the Asian session. However, overall positions in various markets are now cleaner, and we believe that the high correlation across assets will not continue. Bitcoin will only fall to a new low after a substantial drop in the SP.
BTC Implied Volatility
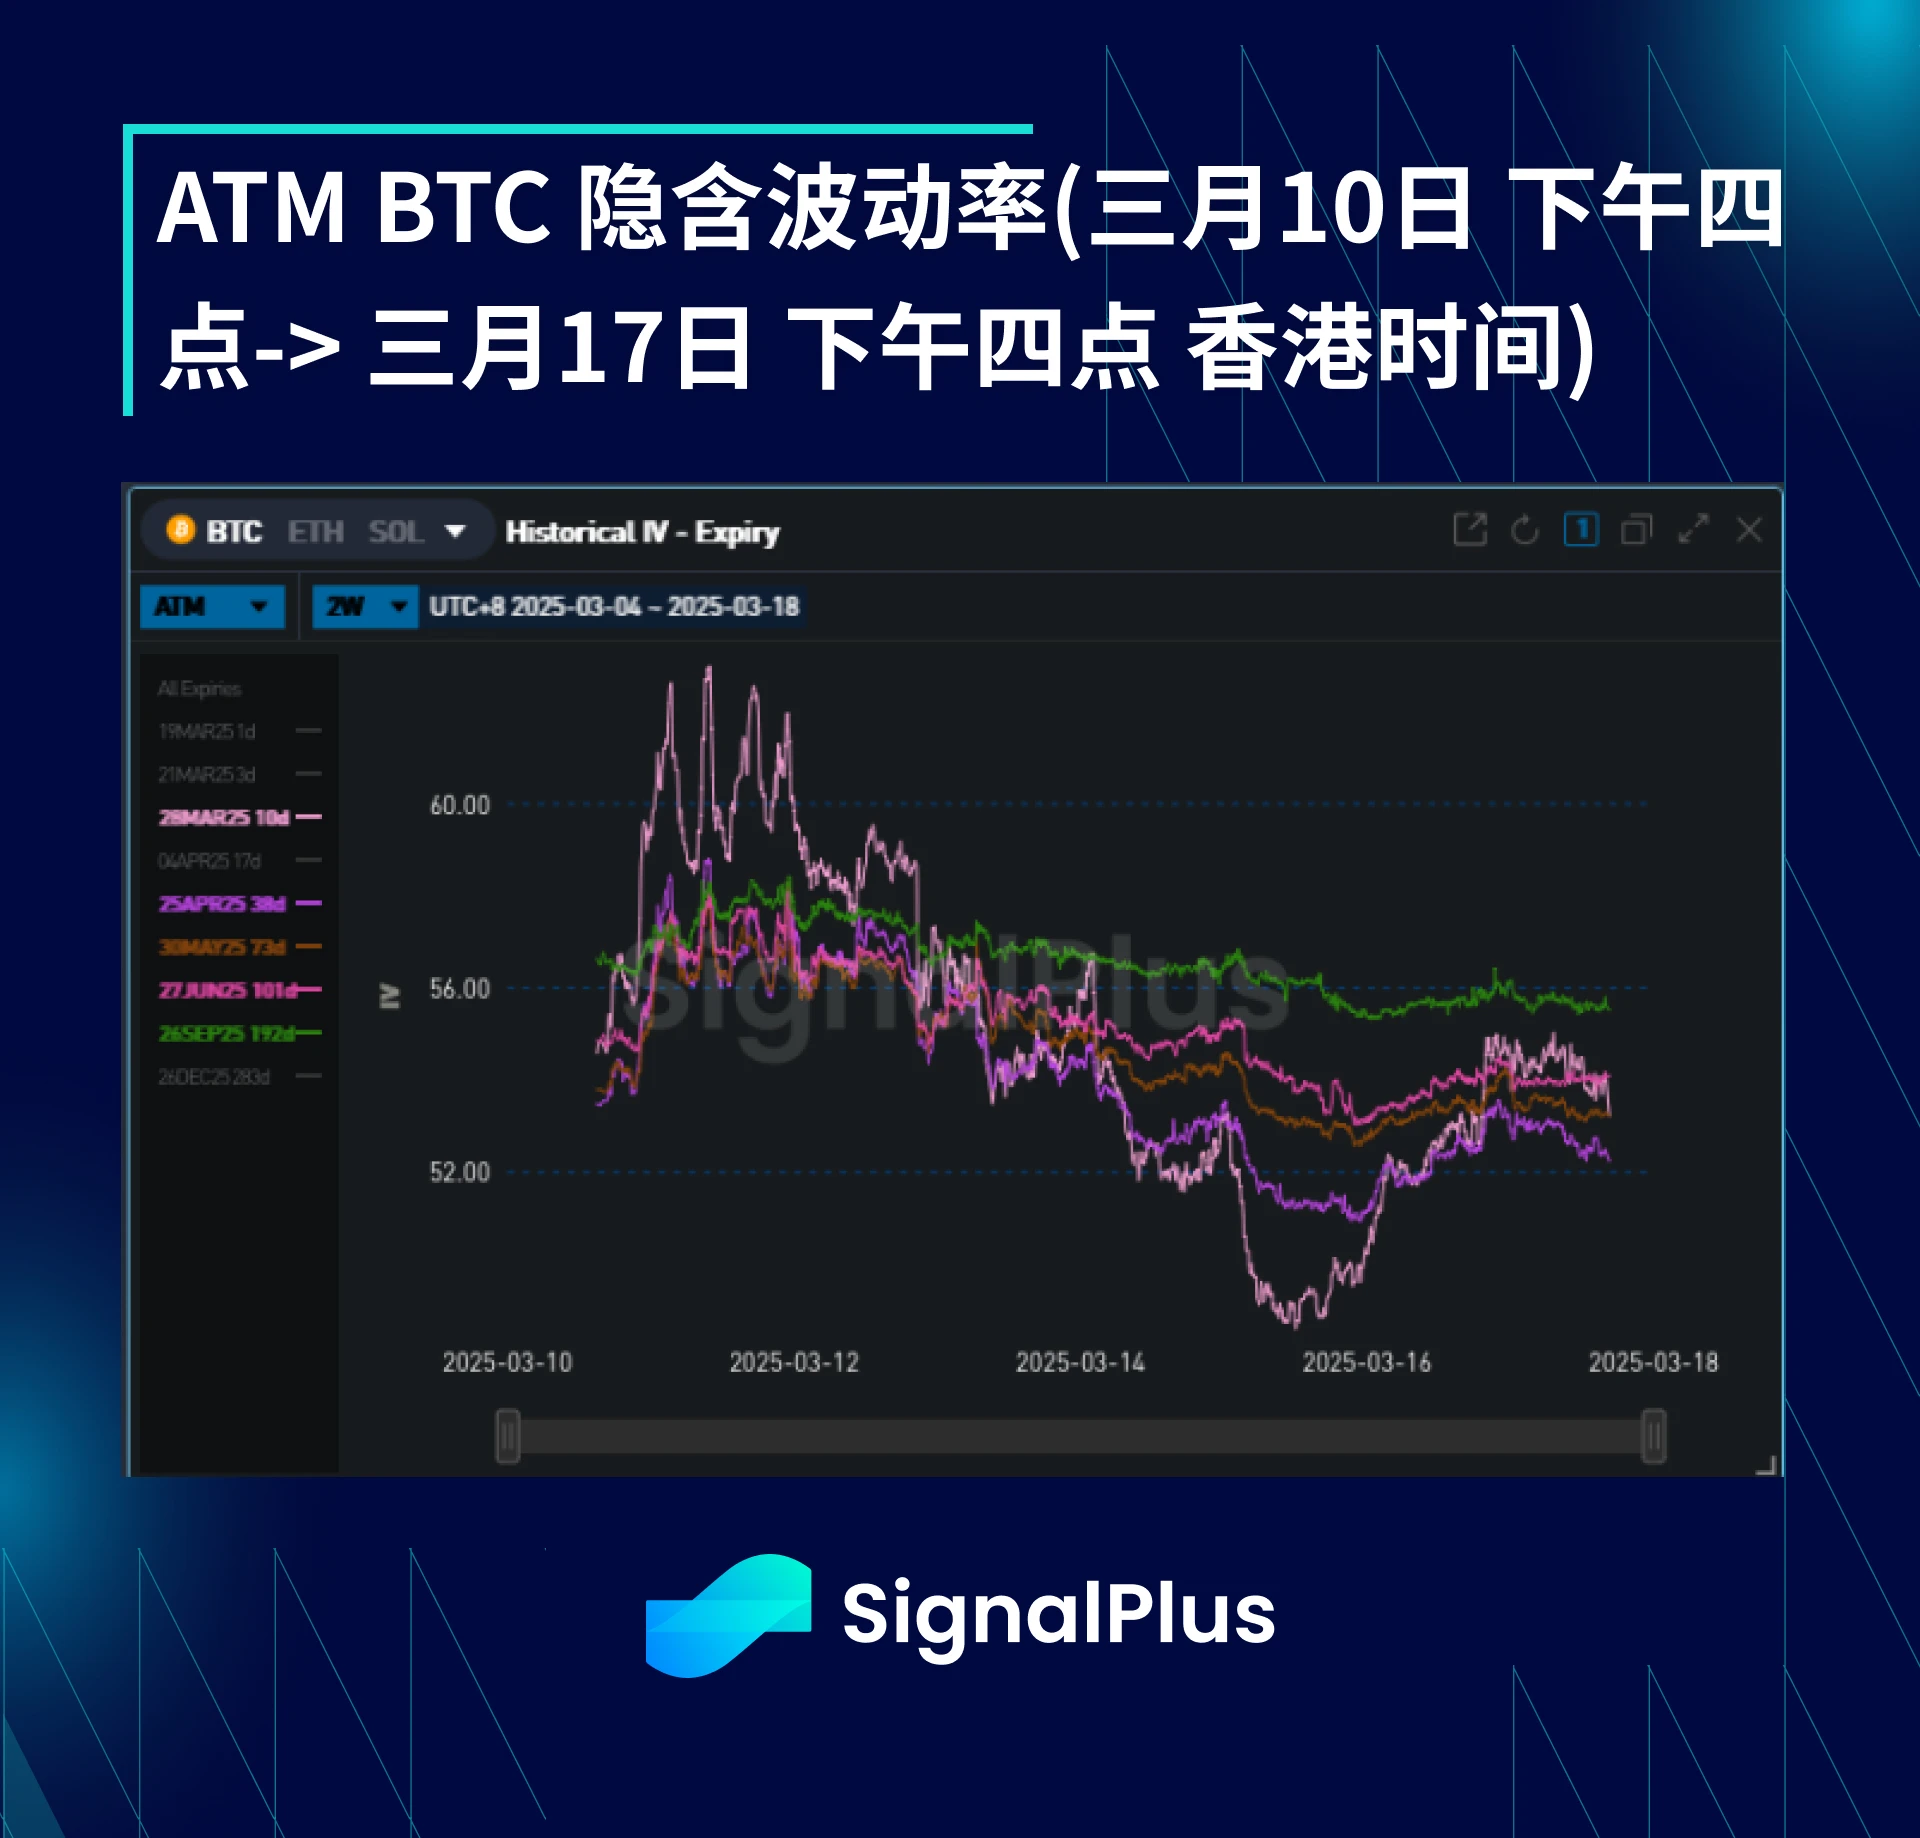
The decline of the SP index in New York on Monday caused a surge in implied volatility in US stocks, while also pulling up the implied volatility of Bitcoin, which fell sharply in the rest of the week. Actual volatility also gradually decreased this week, with the weekly actual volatility falling below 50 points for the first time in recent weeks to the early 40s. The reduction in implied volatility was more significant in short-term expiration dates, while it decreased slightly at the far end of the curve. Selling pressure appeared on the expiration date at the end of June as medium-term players were clearing structural long positions.
From the current situation, we expect the market to continue to stabilize and wait for new catalysts, so realized volatility will remain relatively stable. The April 4 expiration date will attract more attention because Trump will announce the next round of tariffs on April 2, and a considerable premium has been set on the volatility curve of US stock indices and foreign exchange.
BTC Skewness/Kurtosis
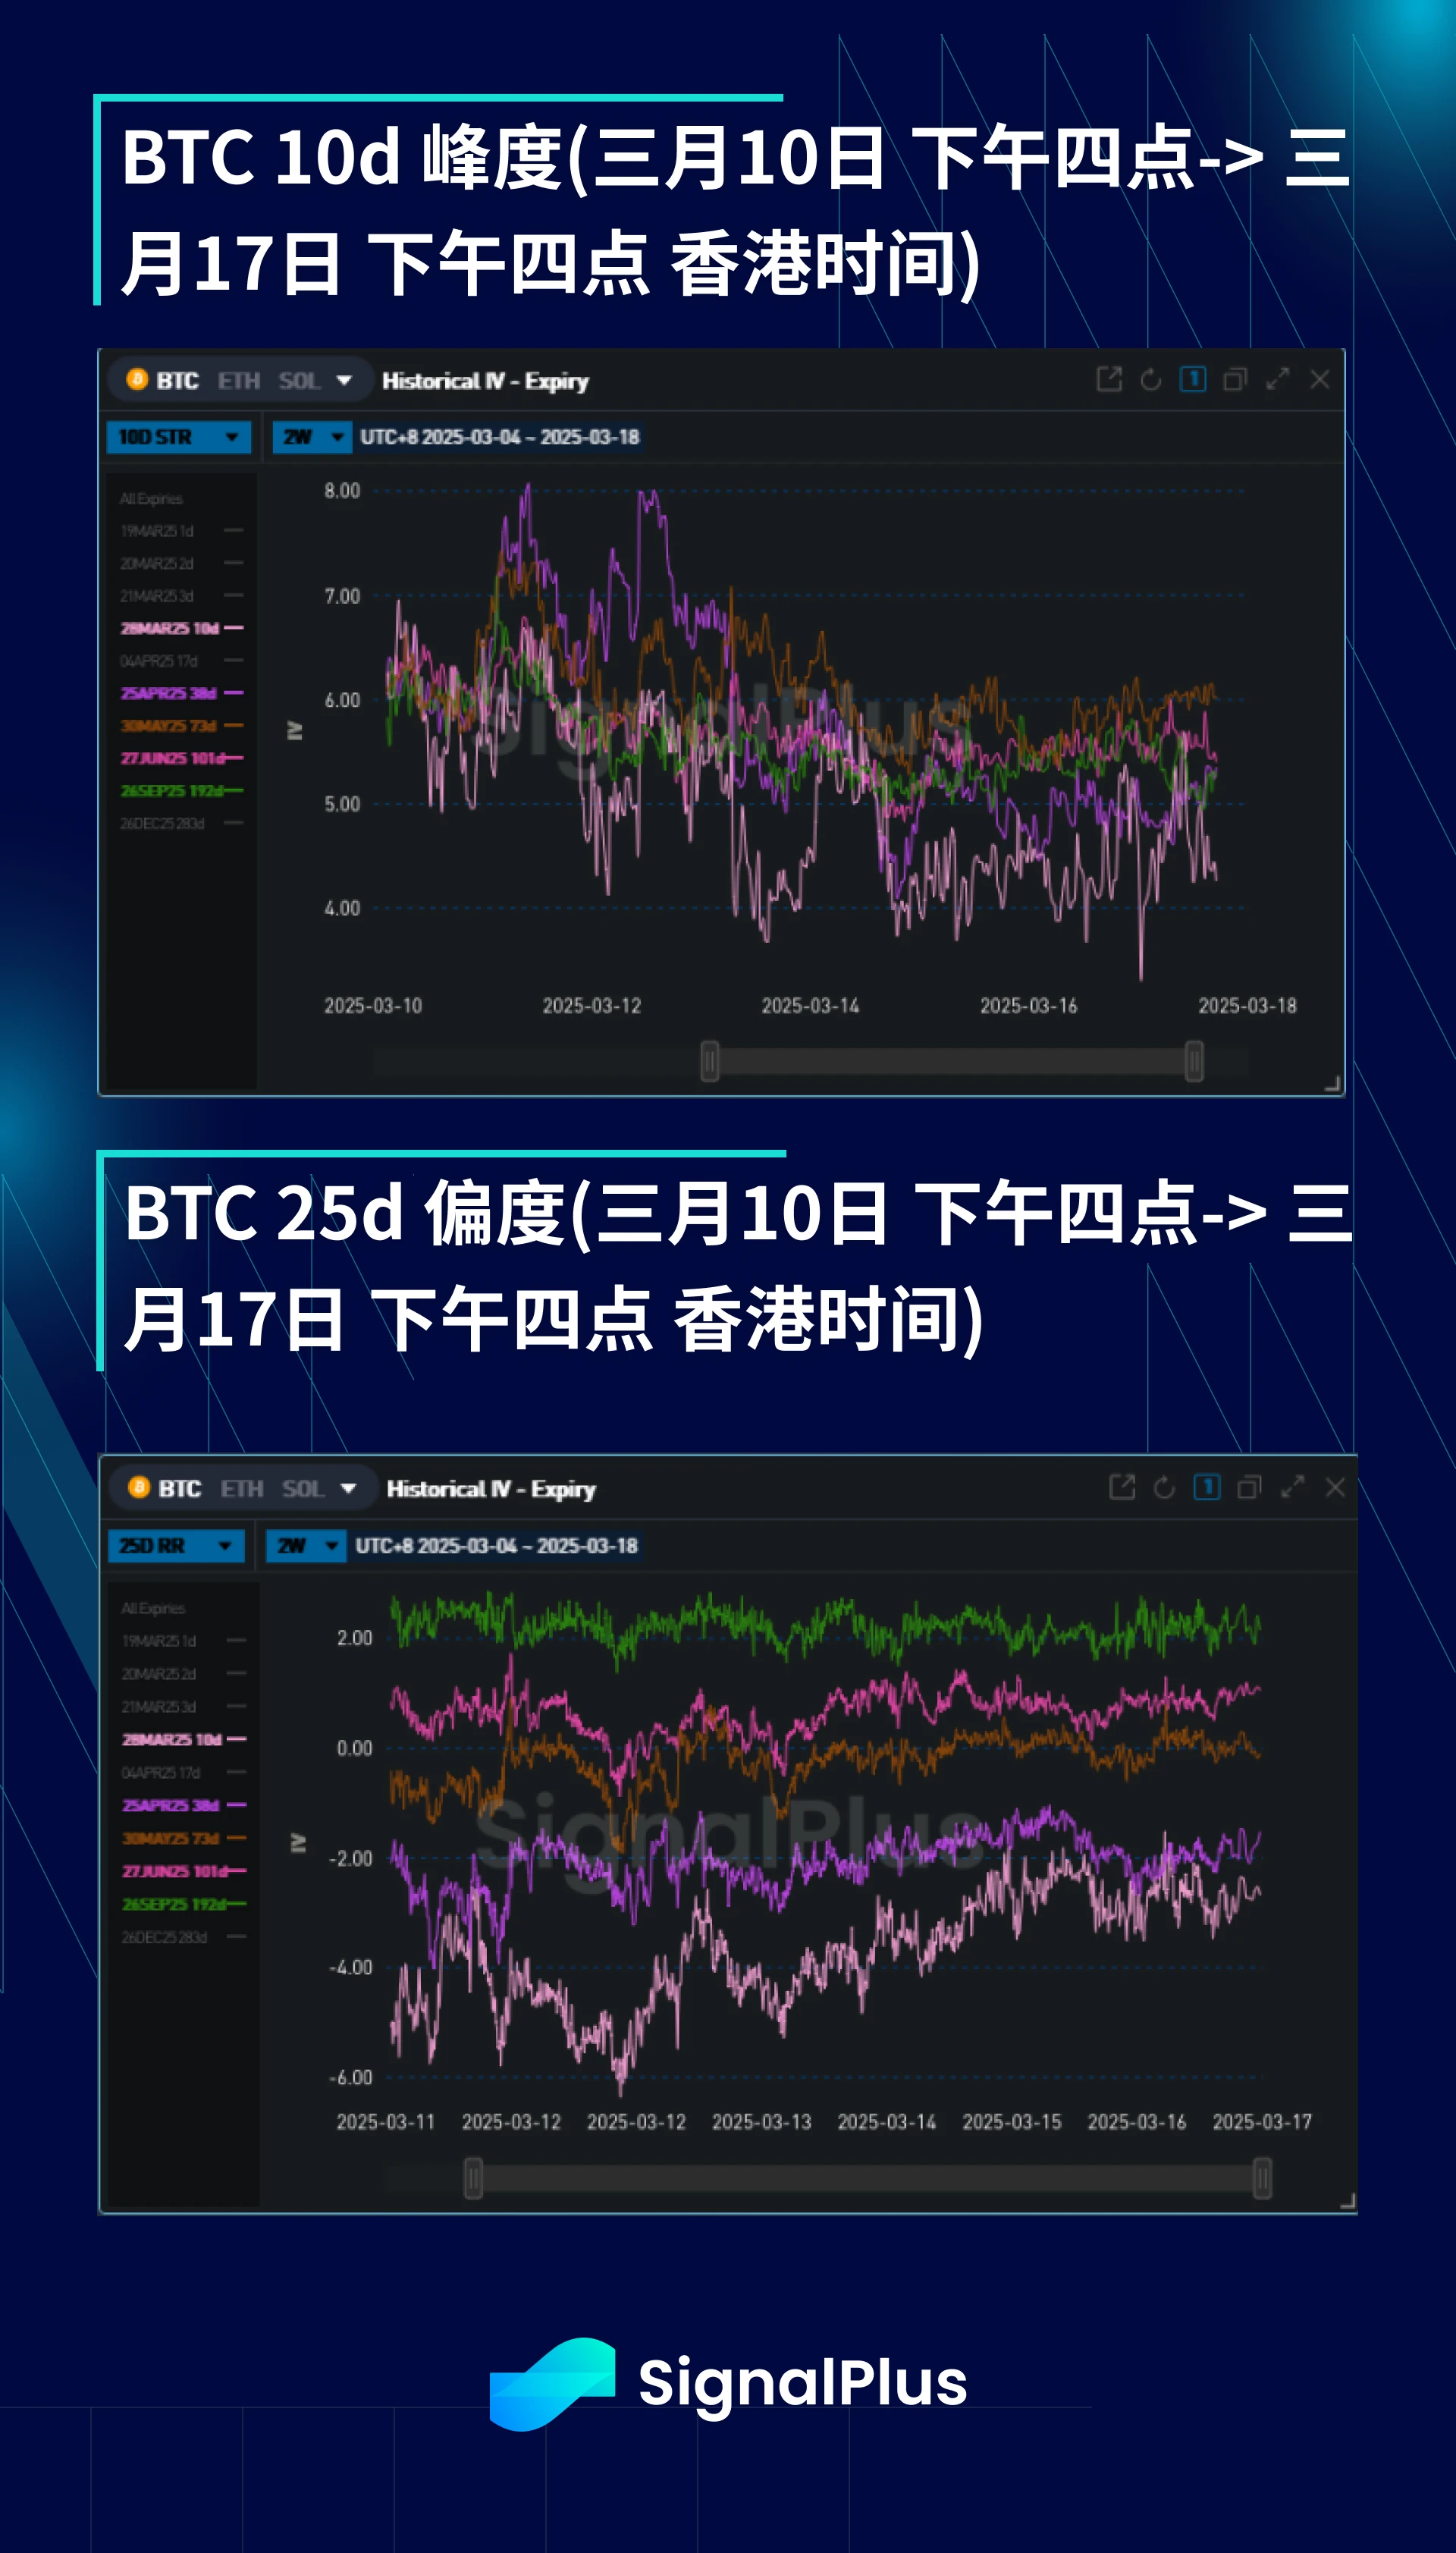
This week, the skewness recovered from the sharp downward bias on the short-term expiration date. Because the markets positions below were very clean after the liquidation from last Sunday to Monday, there will not be too many positions that trigger liquidation when the currency price falls back next time. At the far end of the term structure, the skewness price remains relatively stable because structurally speaking, medium- and long-term players are not interested in the price below.
Kurtosis ended the week largely unchanged. However, it fluctuated significantly during the week as implied volatility changed. Although we believe that long kurtosis is still good, in the short term, long kurtosis may lose money on Theta due to the price fluctuations in a limited range. Therefore, we are more convinced to hold long kurtosis at the far end of the curve, and seek a change in the narrative when the price breaks through the post-election range of 70-105k USD.
Good luck to everyone this week!

You can use the SignalPlus trading vane function at t.signalplus.com to get more real-time crypto information. If you want to receive our updates immediately, please follow our Twitter account @SignalPlusCN, or join our WeChat group (add assistant WeChat: SignalPlus 123), Telegram group and Discord community to communicate and interact with more friends.
SignalPlus Official Website: https://www.signalplus.com


