


Key indicators: (March 31, 4pm -> April 14, 4pm Hong Kong time)
BTC/USD rose 3% (82k USD -> 84.45k USD), ETH/USD fell 11.1% (1,800 -> 1,620)
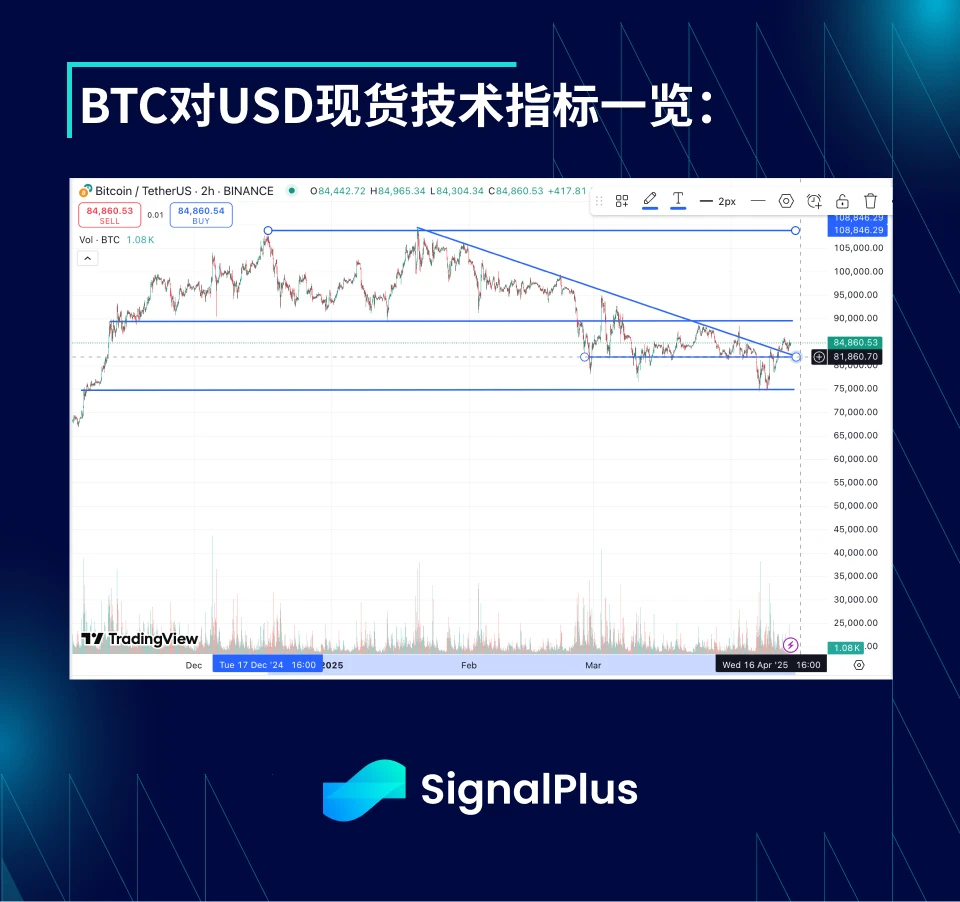
Bitcoin has held up quite well in the past two weeks despite the chaos in other markets. Last week, the price of Bitcoin hit the initial resistance level of $74,000 twice, which was formed after the end of the US election last year, and then broke through the medium-term downward range since January. It is now stuck in the strong support area of 81.8-82.3 thousand dollars, and the strong resistance level above is between 88-90 thousand dollars.
Overall, technical indicators suggest that Bitcoin prices could trade sideways in the $82-88k range over the next few weeks, and current positions in the market also look cleaner. If the double bottom at $74k holds, it would mark the end of the downside correction since the election and pave the way for the coin to rise to $115-120k in the next month.
Market Theme
Global markets have seen extreme volatility over the past two weeks. Trump’s reciprocal tariff policy exceeded even the most hawkish expectations, especially as his pressure on China eventually turned into a retaliatory escalation that resulted in tariffs on both sides exceeding 100%, in other words, making it impossible for the two countries to trade. The VIX panic index soared from 20 in early April to a high of nearly 60 as the market struggled to digest the impact of the tariff incident. Trump spent a week trying to bring countries to the negotiating table, but ultimately failed to shake his position. With the U.S. bond market very fragile, Trump announced a 90-day tariff suspension for other countries except China, which eased market sentiment. The VIX index returned to below 40 at the close of last week.
The impact of this event was not limited to the stock market, in fact the market was very resistant to US assets after the tariff policy was announced, causing the DXY dollar index to fall by nearly 5% in April alone. Long-term US Treasury bonds, once regarded as safe haven assets, also sold off, similar to an emerging asset crisis. It is estimated that there are more than $10 trillion in unhedged US dollar assets held globally. Therefore, although the pace of adjustment in the value of the US dollar has slowed, this trend is inevitable given that the market is re-adjusting Trump-era asset hedges.
As for cryptocurrencies, they have been largely affected by asset volatility in recent times. Bitcoin has dropped to the $74-75k range several times, while Ethereum saw a large liquidation and briefly dropped to $1,400. However, with the 90-day tariff suspension and the decline in the VIX index, the stock market has improved, and Bitcoin has begun to regain its footing, showing a differentiated trend from the traditional market. Ultimately, we still need a more sustained and stable macro backdrop to support Bitcoins rise to $88-90k. Below, we need a new low in the US stock market or a new high in the VIX index for the price to fall below $74k. Overall, the price of the currency is currently stable and sideways before Easter.
BTC ATM Implied Volatility
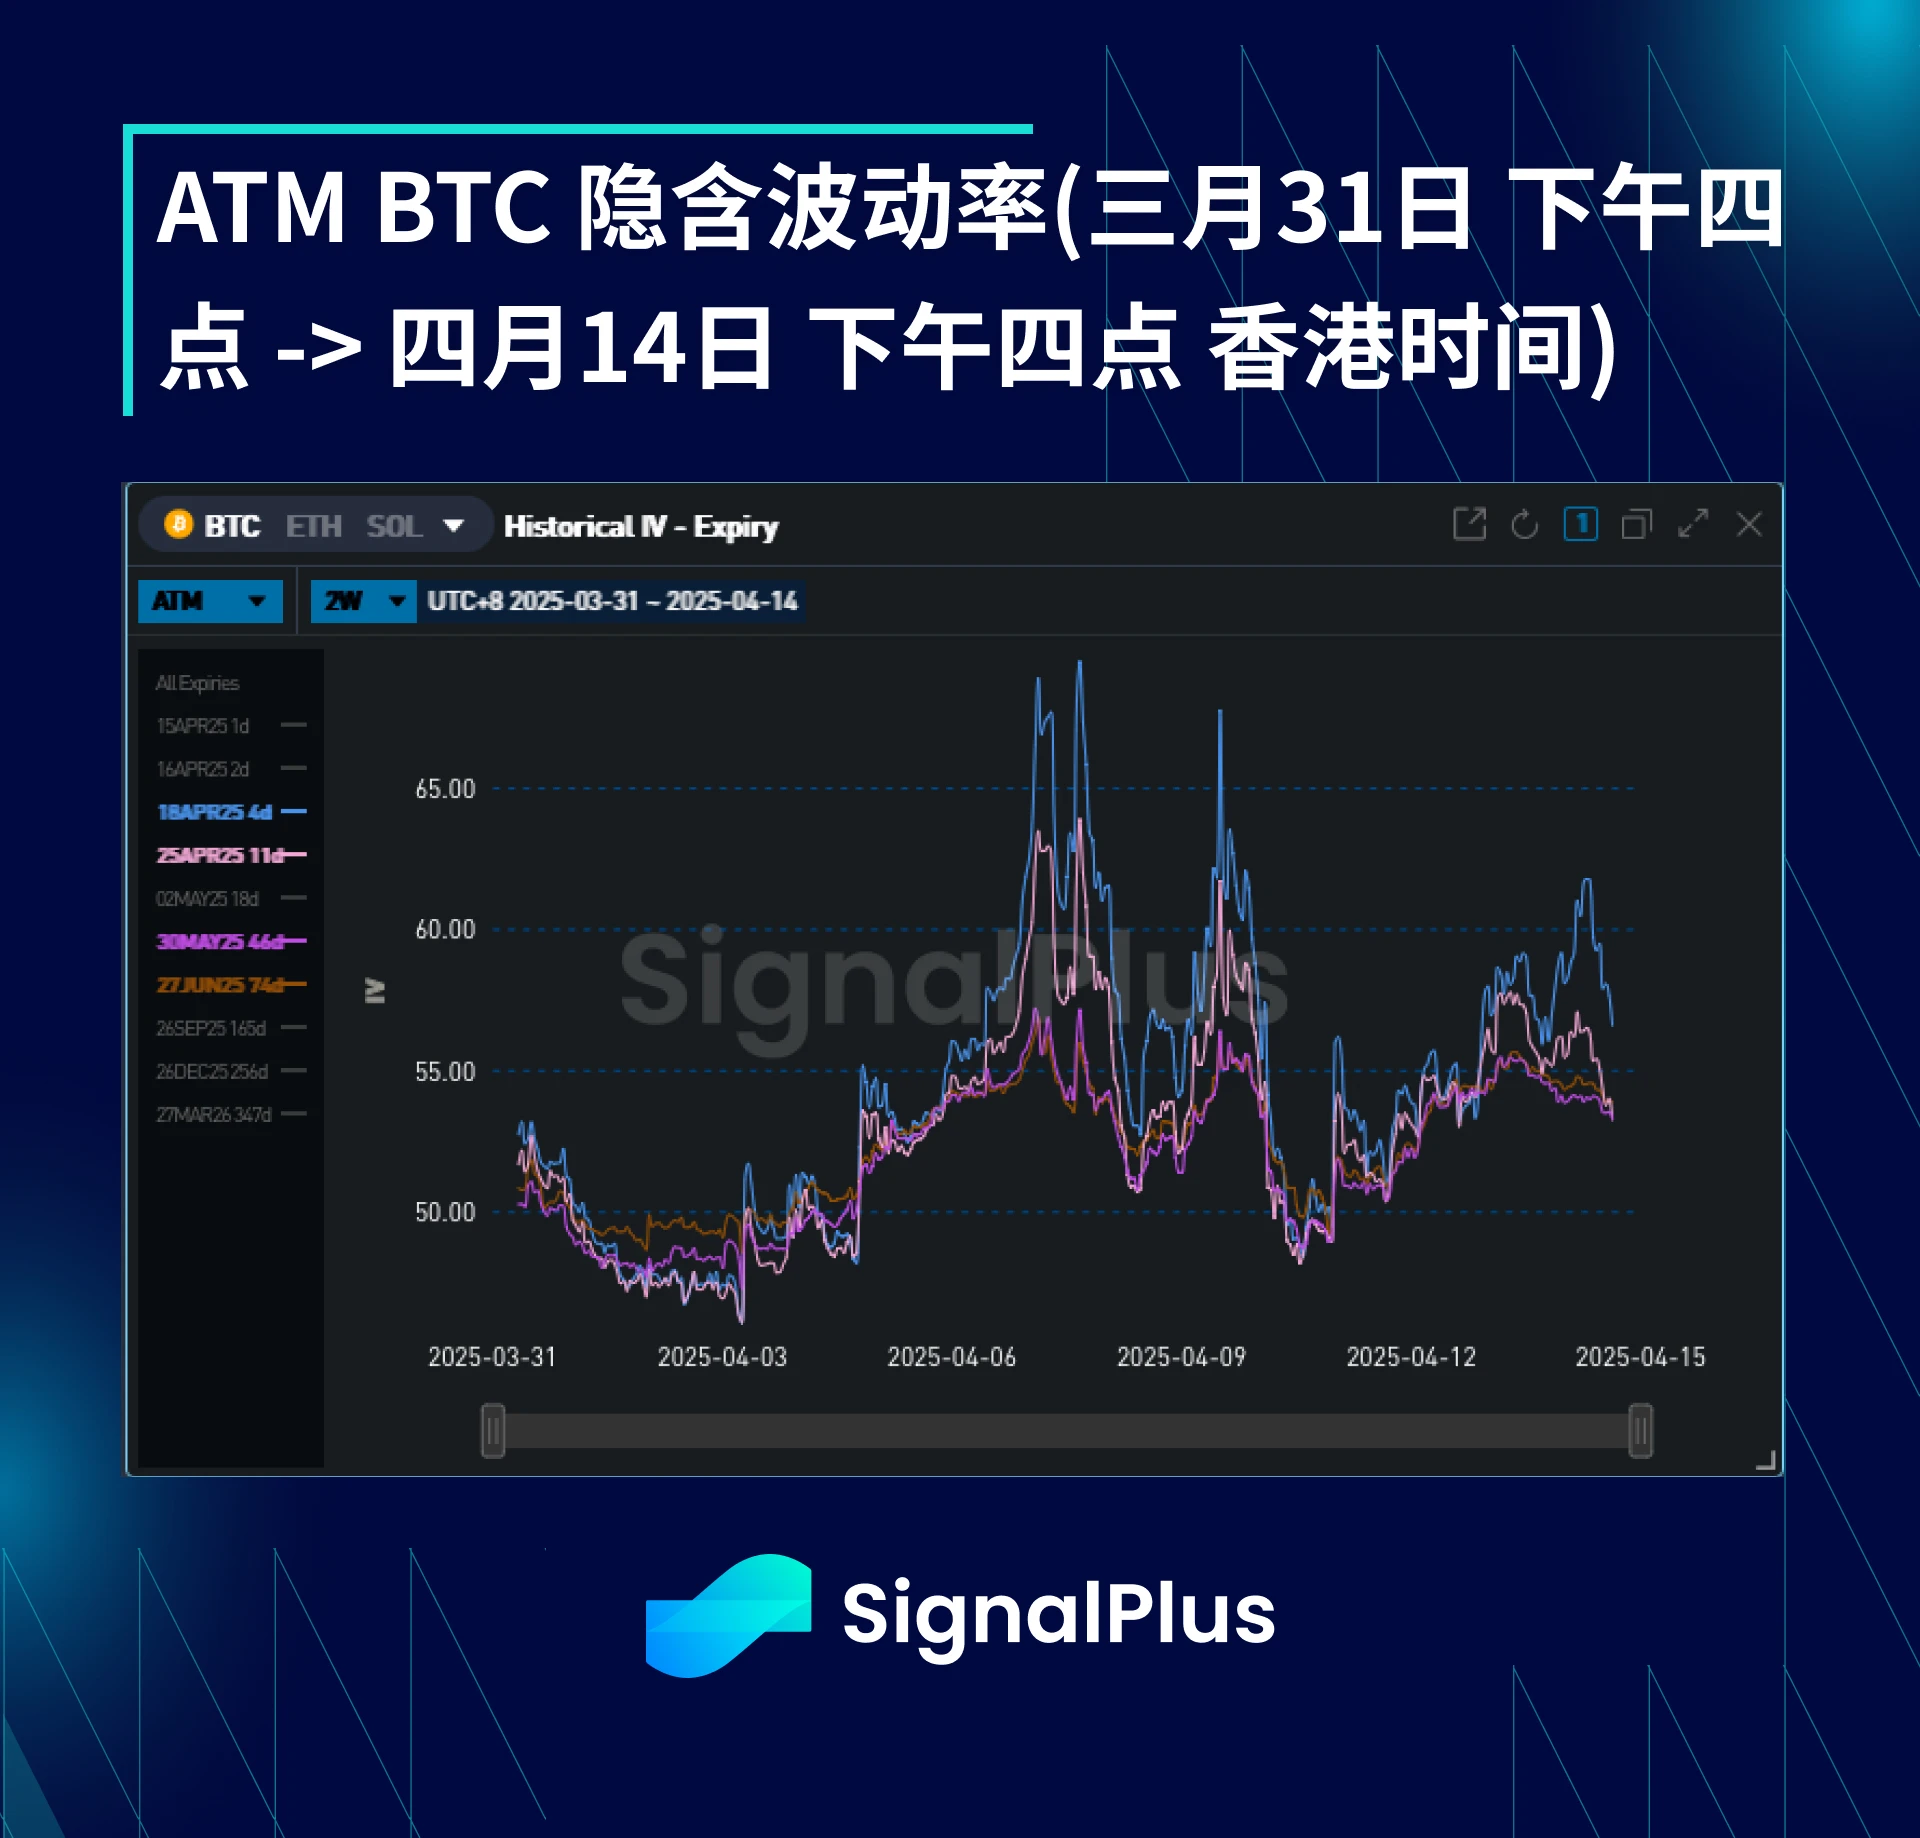
Over the past two weeks, Bitcoin implied volatility has fluctuated wildly along with the stock market. It seems that not many people are buying volatility below the price of the currency, except for some strategic short-term protection needs. Therefore, as realized volatility surges, only the implied volatility of short-term contracts rises, which in turn causes the entire term curve to invert.
With the VIX stabilizing at the end of this week and the US Treasury finding its equilibrium point, it is unlikely that the cryptocurrency market will see higher volatility in the next 90 days. Therefore, we expect to see a lot of selling on both sides as the price stabilizes in the range. If there is further turmoil in the stock market or interest rate market, the risk of central bank intervention will increase (including potential quantitative easing), and these tail risks may push up the volatility of cryptocurrencies again.
BTC Skewness/Kurtosis
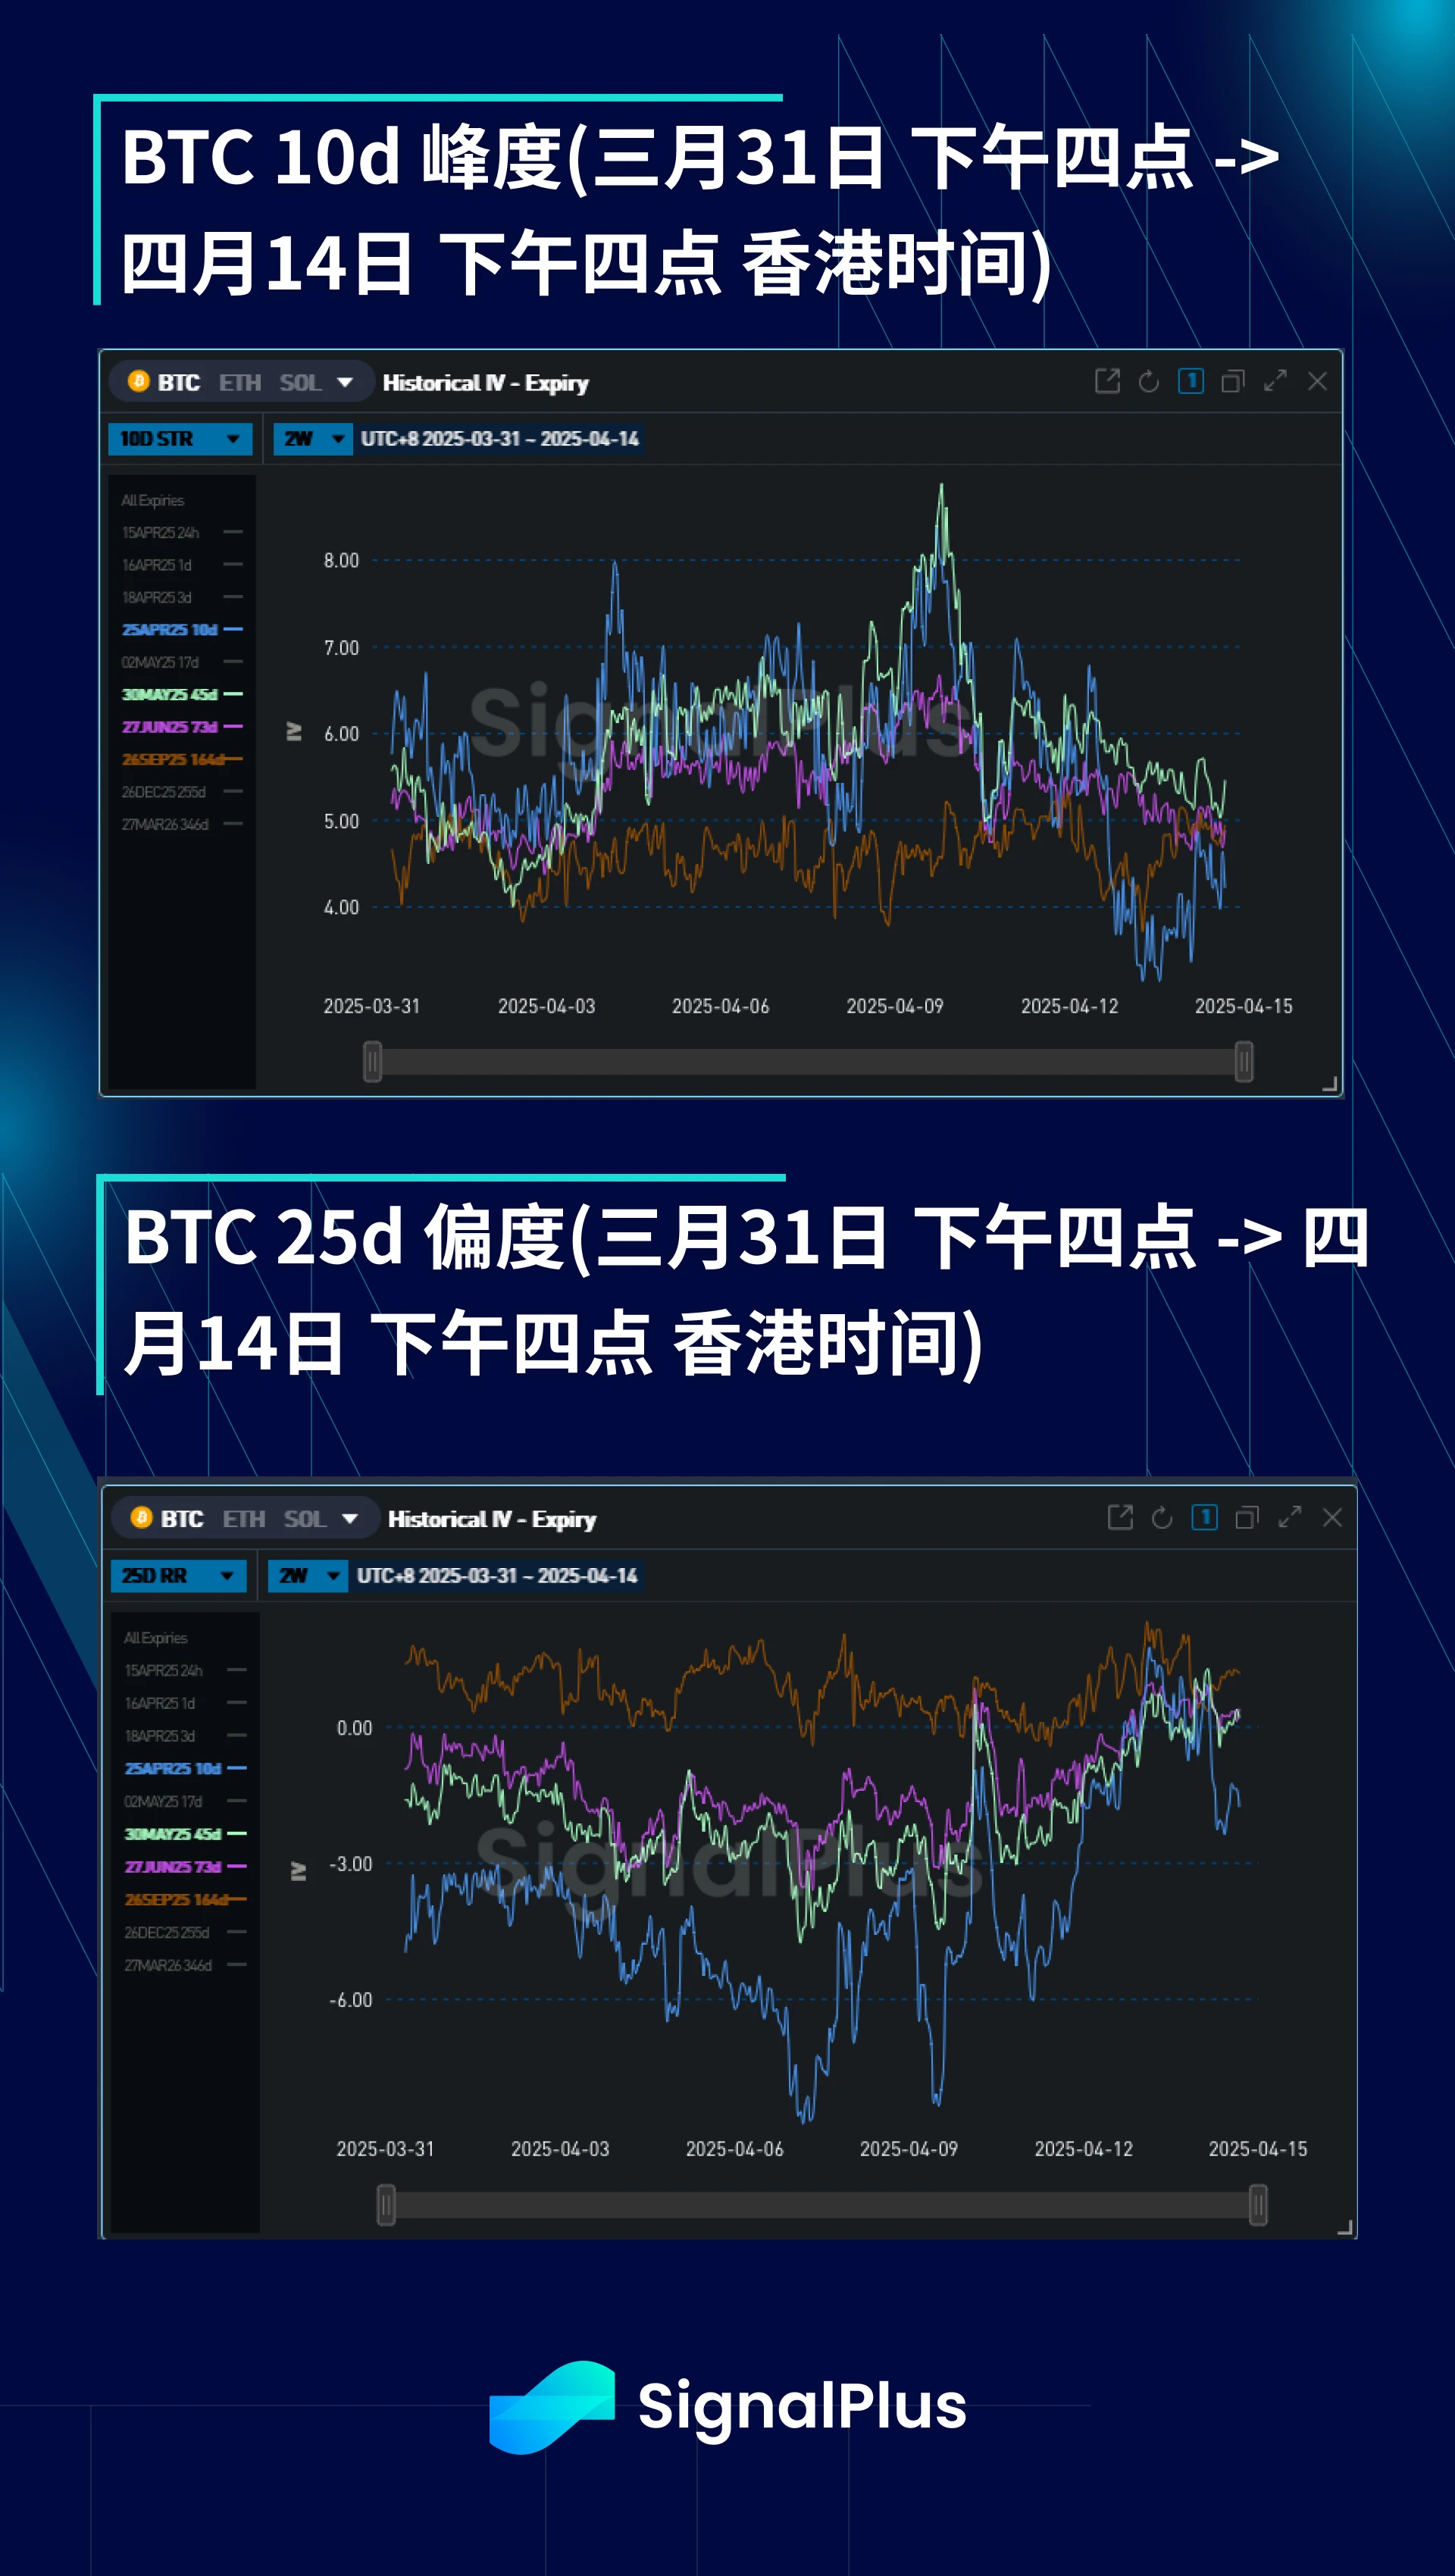
With each rise in VIX or fall in US stocks, the price of skewness skews sharply downwards. Therefore, the current Bitcoin price and SP maintain a fairly high correlation, and the correlation between Bitcoin price and volatility is exactly the same as the SP. The downward slope of skewness is not so obvious outside the April expiration date, so there is not a very large structural downside hedging demand in the market, but we do see some buyers of June $60-70k put options in the market.
Kurtosis ended the week largely unchanged, despite fairly wild swings in implied volatility and a high correlation between price and skewness (skewness falls sharply when price falls, and returns when price returns). Overall, prices have been mostly localized lately, while relatively stable in the medium-term range of $74-90k, so the market is not very interested in buying the flanks. Structurally, we still think the flanks are underpriced, based on fairly volatile volatility and the dynamics of spot versus skewness.
Good luck next week!

You can use the SignalPlus trading vane function for free at t.signalplus.com/news , which integrates market information through AI and makes market sentiment clear at a glance. If you want to receive our updates in real time, please follow our Twitter account @SignalPlusCN, or join our WeChat group (add the assistant WeChat, please delete the space between English and numbers: SignalPlus 123), Telegram group and Discord community to communicate and interact with more friends.
SignalPlus Official Website: https://www.signalplus.com


