


Key indicators: (March 3 at 4 pm -> March 10 at 4 pm Hong Kong time)
BTC/USD fell 10.7% ($92,200 -> $82,300), ETH/USD fell 14.8% ($2,430 -> $2,070)
BTC to USD spot technical indicators at a glance
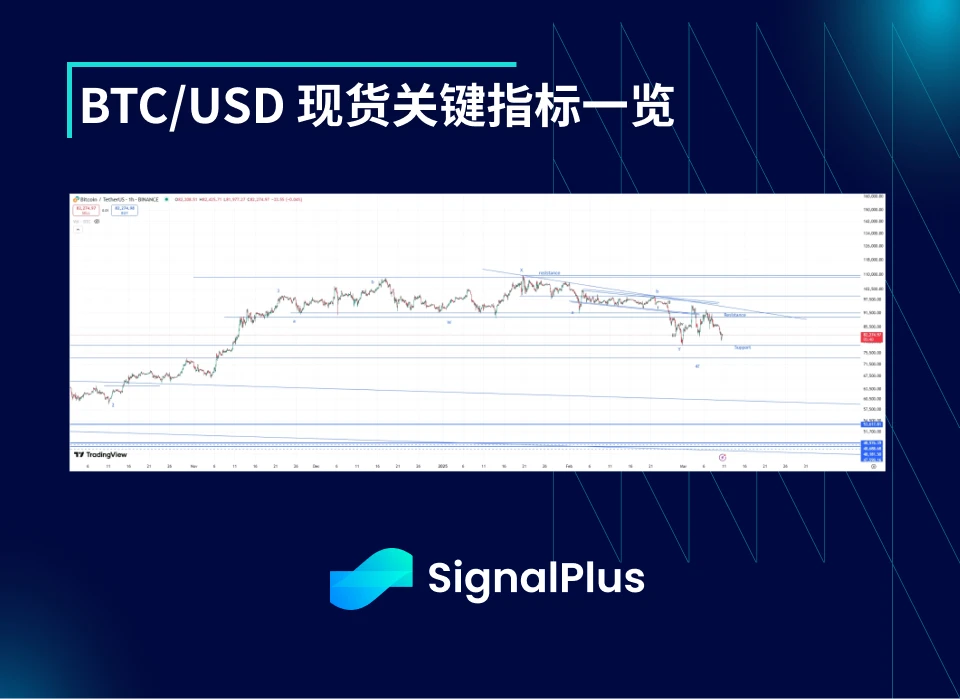
The volatility of the market continued to be high due to a series of news and cryptocurrency-related events last week. Ultimately, the price of the coin failed to gain a foothold and continued to fluctuate in a wide range, with downside support at $79-73k and upside resistance at $89-93k.
We had hoped that last weeks bottoming and rapid rebound would signal the end of the long correction, but the price action has not been as expected. Above the initial decline, resistance includes $95k-96k, then $100k-102k, and finally $110k. Below $73k, a retracement to $65k-67.5k is likely, after which the price action will be more complicated than the overall upward trend currently expected. We still maintain a medium-term bullish view, but in the absence of strong upward momentum, the timeline may be further extended.
Market Theme
The VIX rose from 20 to 26 as the implementation of US tariffs reignited fears of a global trade war. Meanwhile, European and German defense spending triggered a sell-off in German government bonds, which spread to Japanese government bonds, British gilts and US bonds, further complicating the entire risk market. It seems that the Trump administration is very eager to reduce long-term interest rates and refinancing costs and ease economic conditions, although achieving this goal may lead to further selling and capital withdrawal from US risk assets. Non-farm data was slightly weak, and this trend may continue under the pressure of DOGE (government efficiency department).
Back to cryptocurrencies, the rally caused by Trumps tweet was short-lived. Pressure from the US stock market triggered a sharp reversal of the price from $95k a week ago to $81k-82k. The price then found support as the US stock market climbed from the bottom and the optimism from the cryptocurrency summit on Friday. On Thursday night, Trump signed an executive order announcing the use of existing Bitcoin for cryptocurrency reserves. Although the news hinted that there would be no more buying, which was disappointing, it was still a step in the right direction for Bitcoin at least (no other tokens were mentioned). After the market sentiment recovered on Friday night, the price of the currency briefly touched the resistance level of $90k-91k, but the market continued to test the decline after the summit without any new news. In the low liquidity session on Sunday night, Bitcoin was sold off below $80k, Ethereum fell below $2k, and Solana fell below $125.
BTC Implied Volatility
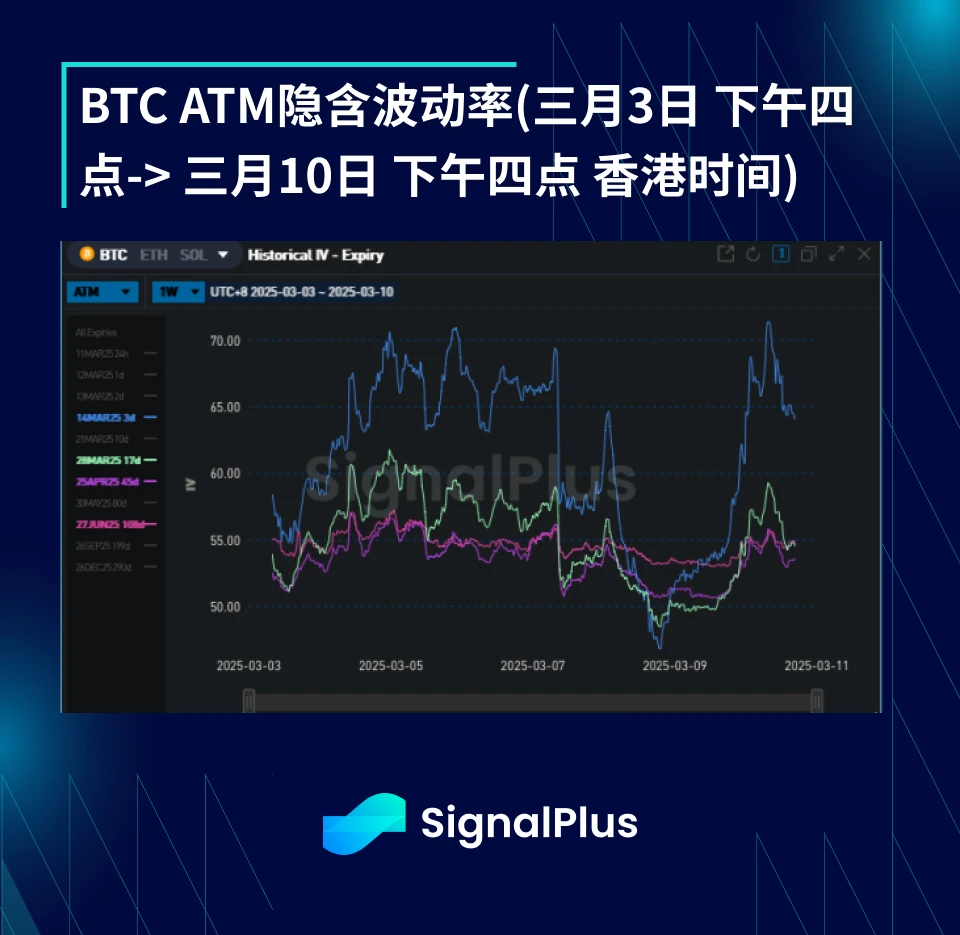
Although implied volatility fluctuated quite a lot during the week, it was basically unchanged week-to-week in the end. Implied volatility was pushed up by the run before the crypto summit, and overnight volatility pricing fluctuated by 5% at one point. Very high realized volatility also supported the increase in implied volatility before the summit. But after the meeting without any new news and very reserved price action, implied volatility was oversold, and the implied volatility for the March 14 expiration was briefly sold to 47, and then rebounded sharply after the price of the currency was sold off on Sunday.
Realized volatility remains in the high 50s to 60s, the highest level in recent times, as the market is still trying to balance in the new range. Although we expect the market to continue to fluctuate locally in the next few days, we think realized volatility will return to the mid-40s after this week, given the cleaner positioning of the market.
BTC Skewness/Kurtosis
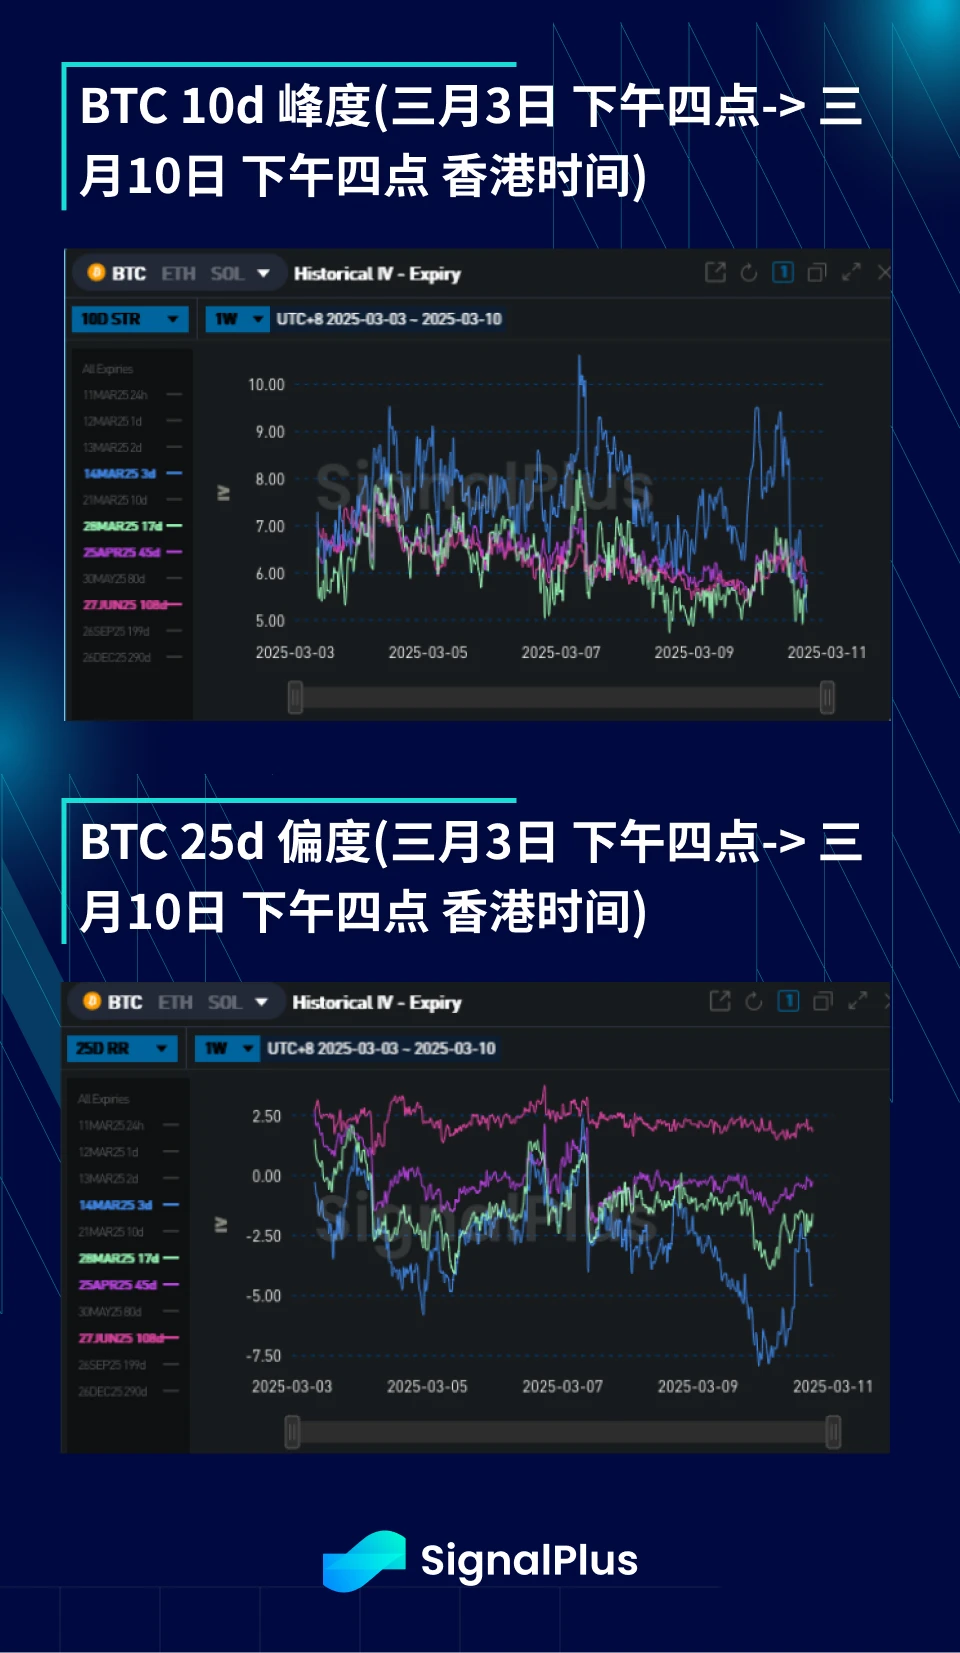
The skewness on the short-term expiration dates is biased downwards. This is because the price of the currency has fallen more violently from high levels than it has risen (except for the time when Trump tweeted). On the more distant curve, the skewness has turned upwards since April and May, because structurally the market is unwilling to deploy positions below the price of the currency.
Although the kurtosis ended the week basically unchanged, the intra-week changes were quite dramatic and highly correlated with the price of the currency. However, since the price of the currency remains locally volatile and players mostly use call or put spread options to configure directional positions, it can be seen that the weight of the wing of the smile curve is pulled down and the kurtosis falls in the short term, but we recommend holding the wing for protection.

You can use the SignalPlus trading vane function at t.signalplus.com to get more real-time crypto information. If you want to receive our updates immediately, please follow our Twitter account @SignalPlusCN, or join our WeChat group (add assistant WeChat, please delete the space between English and numbers: SignalPlus 123), Telegram group and Discord community to communicate and interact with more friends.
SignalPlus Official Website: https://www.signalplus.com


