


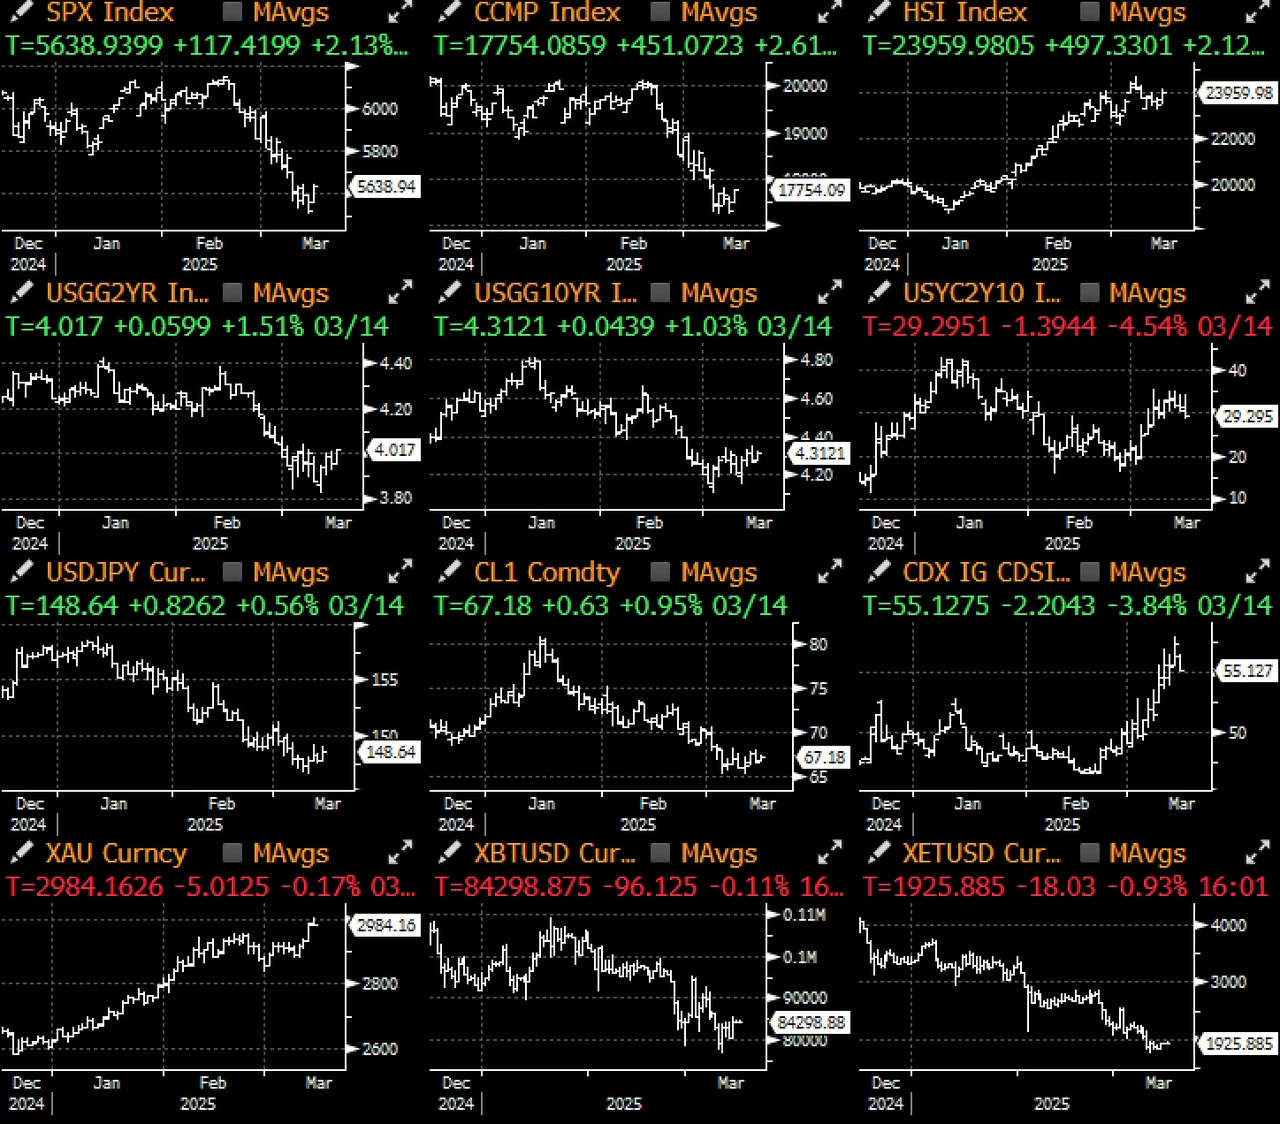
Last week, asset markets experienced another roller coaster ride, but with various technical indicators (such as the CBOE put-call ratio rising to its highest level since last summer) showing extreme oversold conditions, the market saw a nice rebound on Thursday/Friday. The lack of new tariffs or geopolitical news, the lifting of the risk of a US government shutdown, and the extremely oversold state of US stocks provided momentum for the markets rebound of more than 2% last Friday, but trading volume was still low.
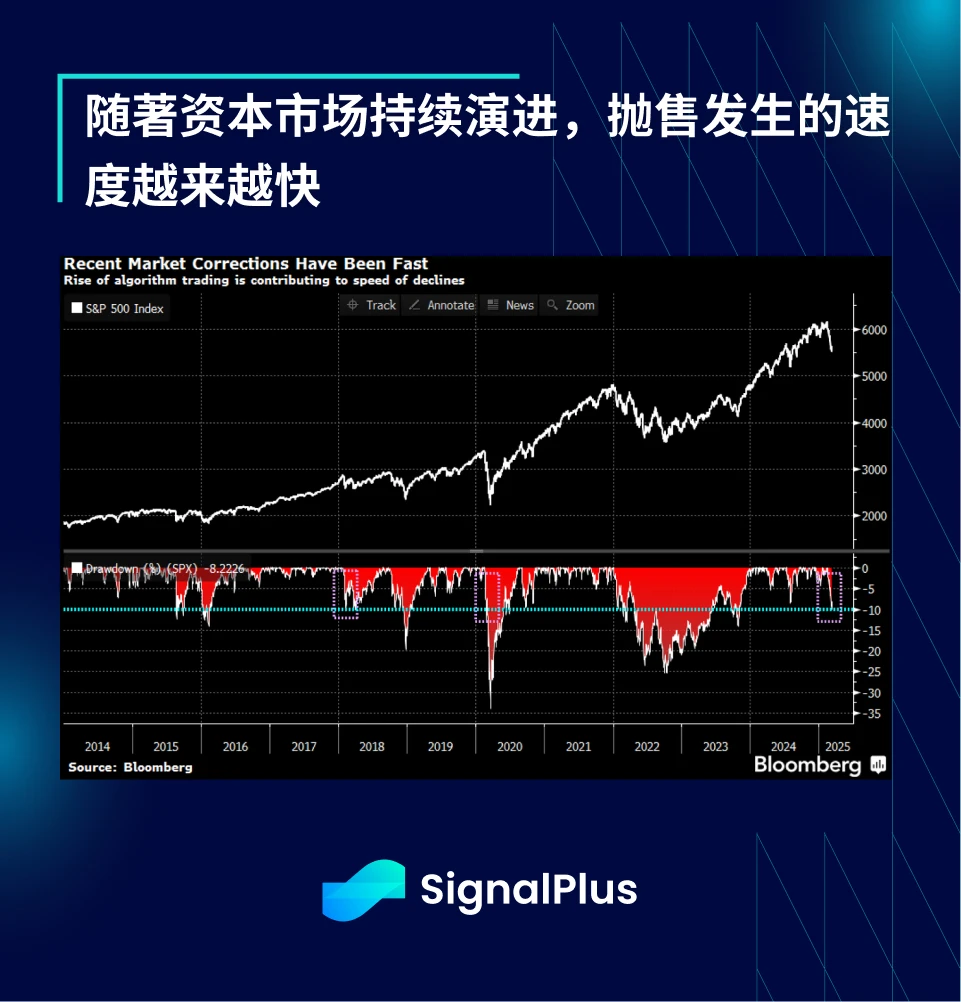
According to Bloomberg, due to the popularity of automated trading systems and strict risk control mechanisms, the SPX index fell more than 10% from its recent high in just 16 days. With the advancement of technology, market corrections are getting faster and faster. The three recent major sell-offs (2018, 2020 and 2025) were among the most sharp corrections on record.
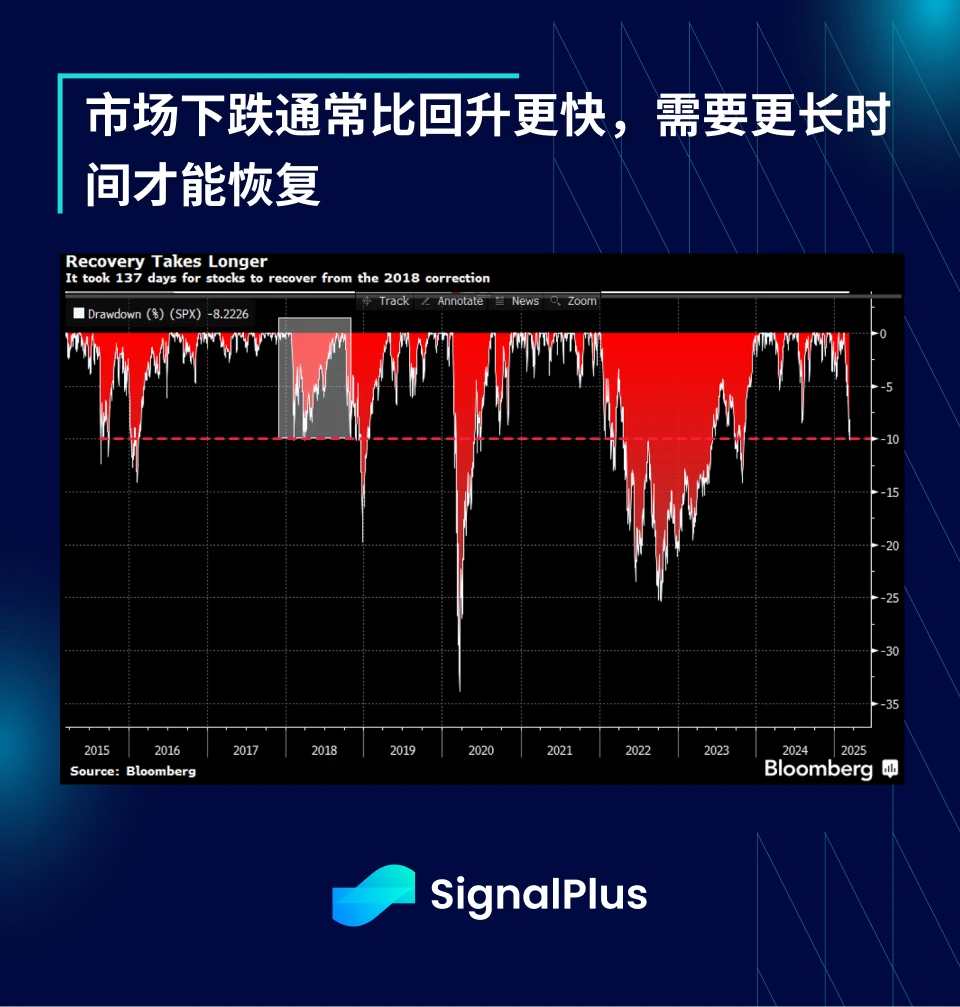
In contrast, market recoveries often take longer because contemporary fund managers are subject to strict risk control constraints. It took only two weeks for the SPX to fall 10% in 2018, but it took nearly 4.5 months to fully recover the losses. Bloomberg pointed out that in the past 24 times when the market fell by more than 10%, the average recovery time was about 8 months, reflecting that the market usually rises slowly and falls sharply.
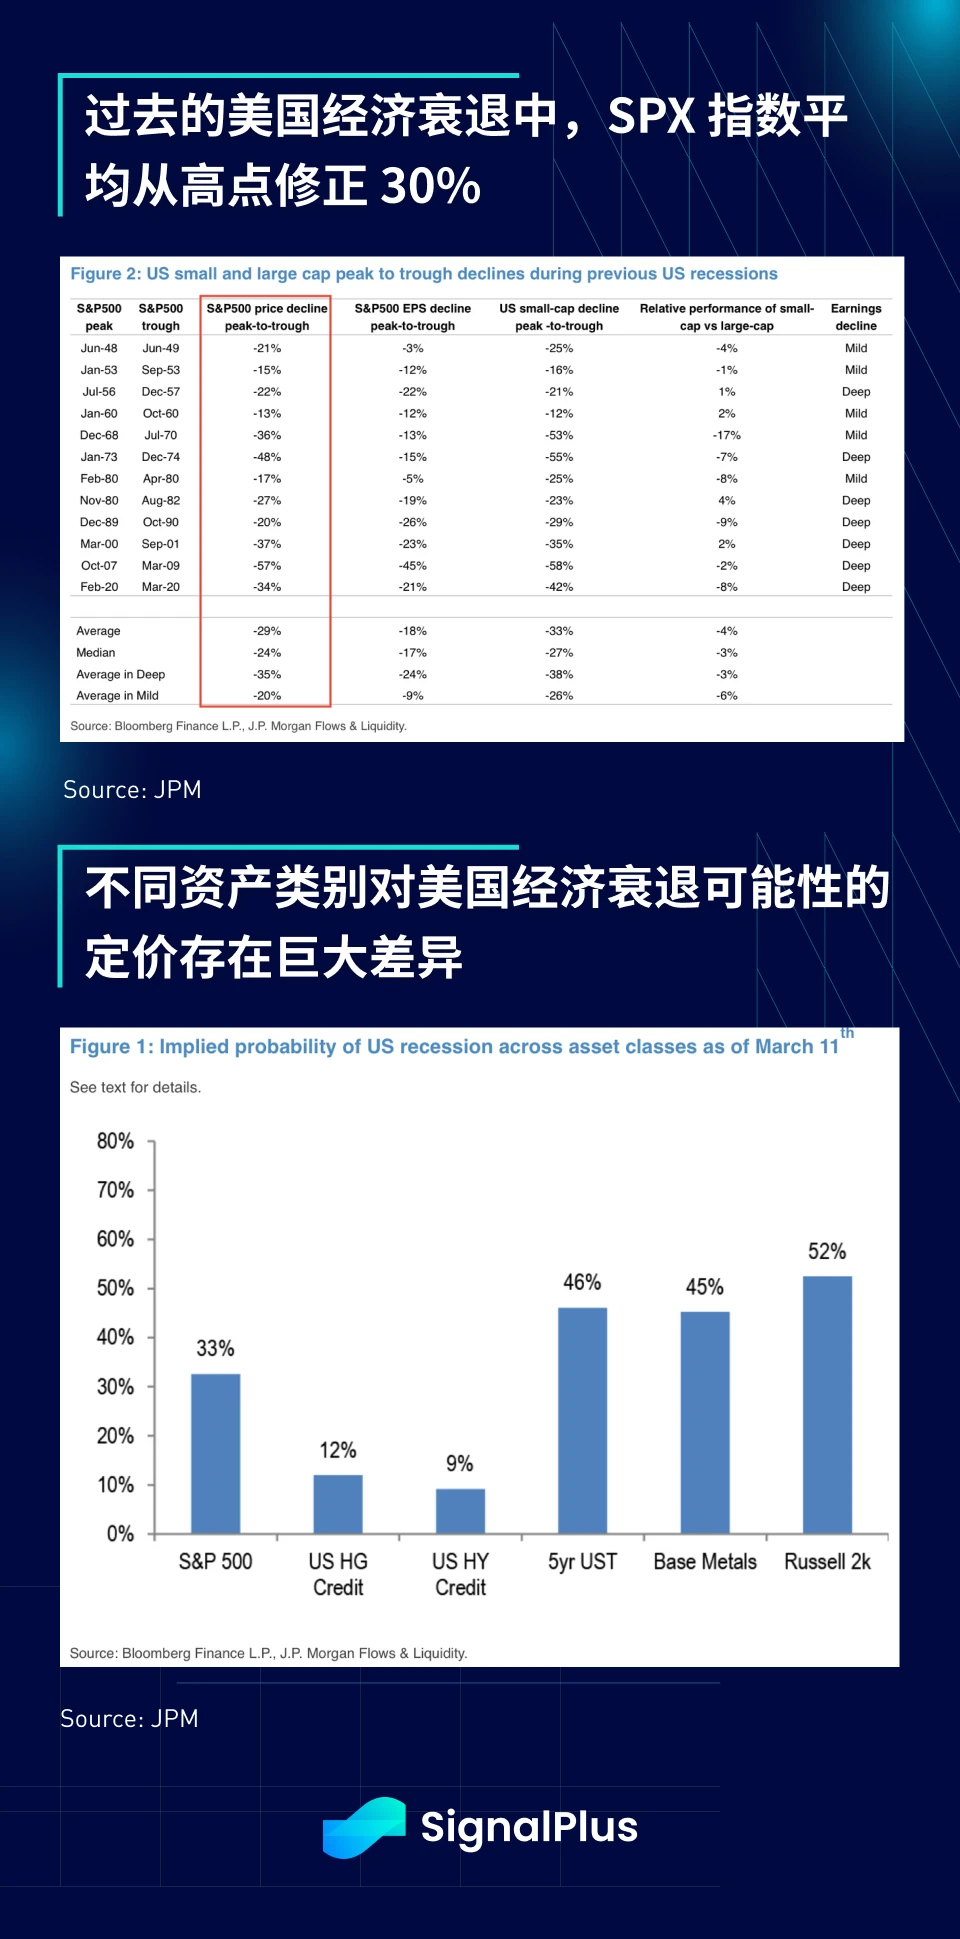
According to JPMorgan Chase, the average decline in the US stock market from peak to trough in the past 12 US recessions was about 30%, while the current adjustment of SPX is only 9.5%. Simple calculations show that the current implied probability of a recession in the stock market is about 33%, the implied probability of commodities and US bond markets is close to 50%, and the implied probability of a recession in the credit market is only 10%.
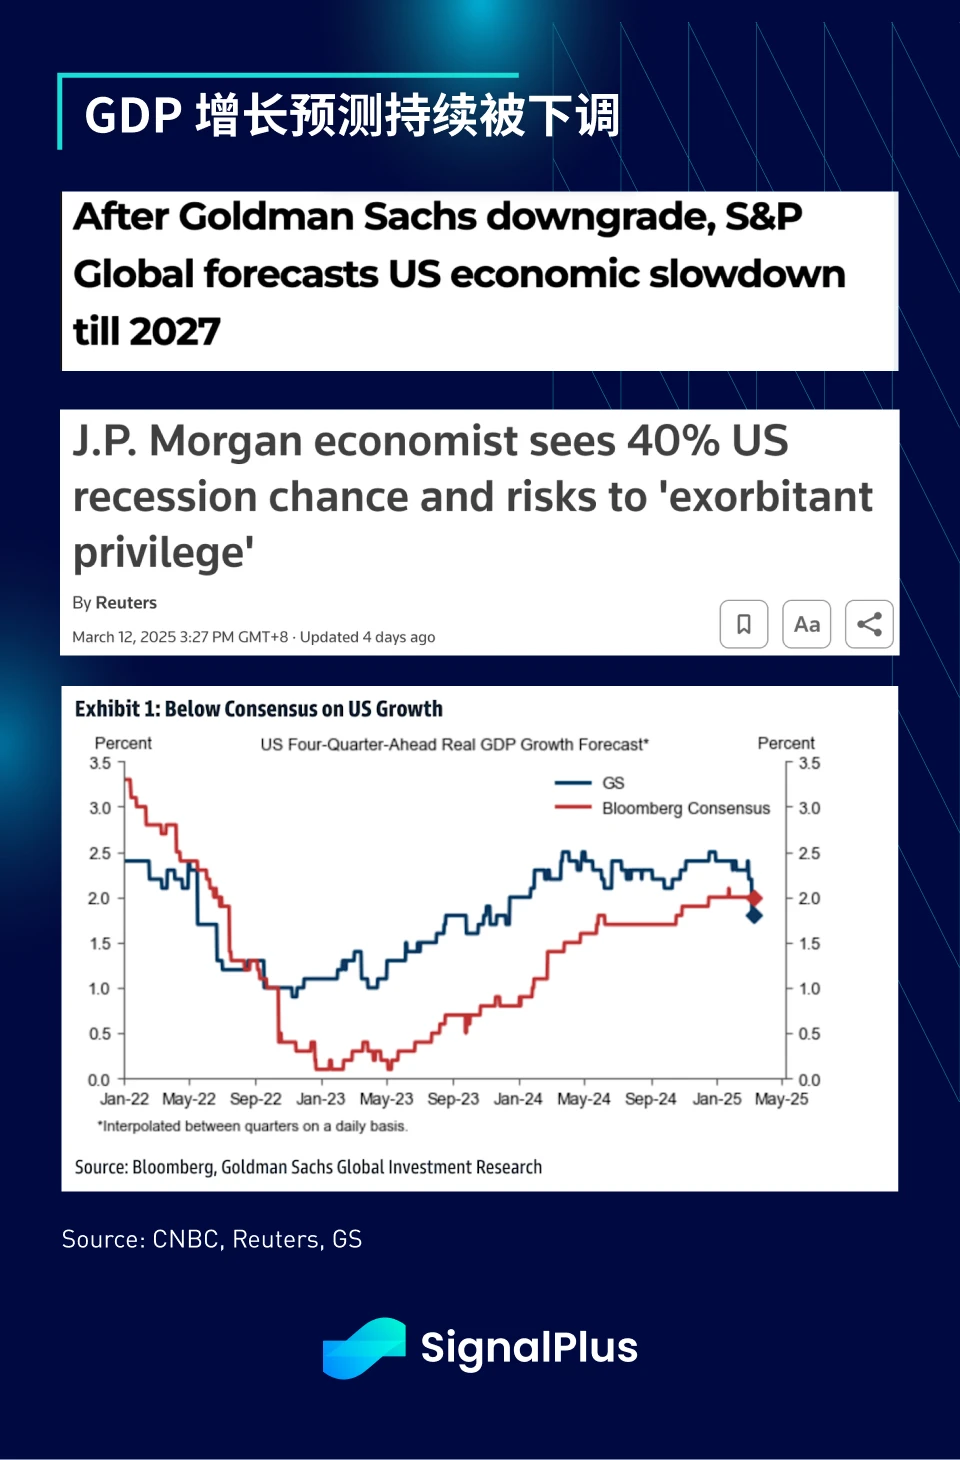
Although the market is still trying to gain a foothold, Wall Street economists have already responded in advance. Goldman Sachs became the first major investment bank to significantly lower its forecast for US GDP growth in 2025, cutting the growth forecast from 2.4% to 1.7%, and pointed out that due to the increased impact of tariffs, the main reason for the reduction is that the assumptions about trade policy have become more unfavorable. At the same time, JPMorgan Chase raised the probability of a US recession to 40%, noting that its exorbitant privilege of relying on low financing rates, high capital flows and attractive US dollar assets to support the rising fiscal deficit is at risk.
Additionally, with Democrats having almost completely conceded to Trump in the government shutdown negotiations, this paves the way for DOGE to continue its aggressive cost-cutting campaign until at least September.

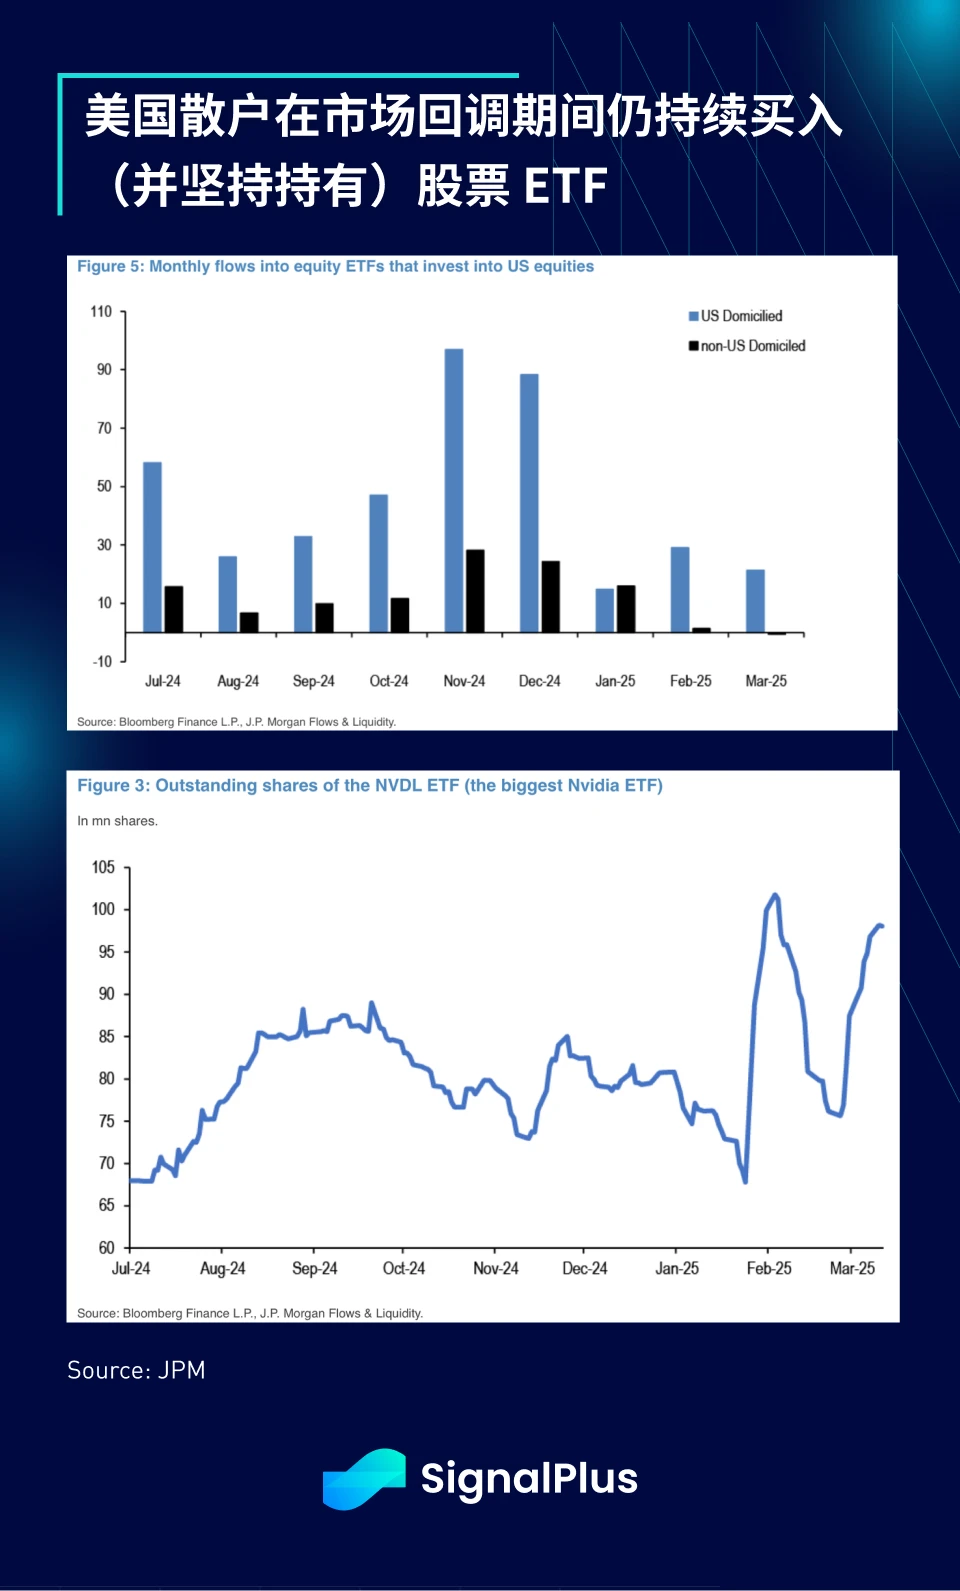
Judging from the data, retail investors do not seem to have responded to the economic slowdown in advance. US stock ETFs have seen net inflows almost every day since the market peaked in February, and holdings of growth ETFs (such as Nvidia) have also rebounded to near historical highs.
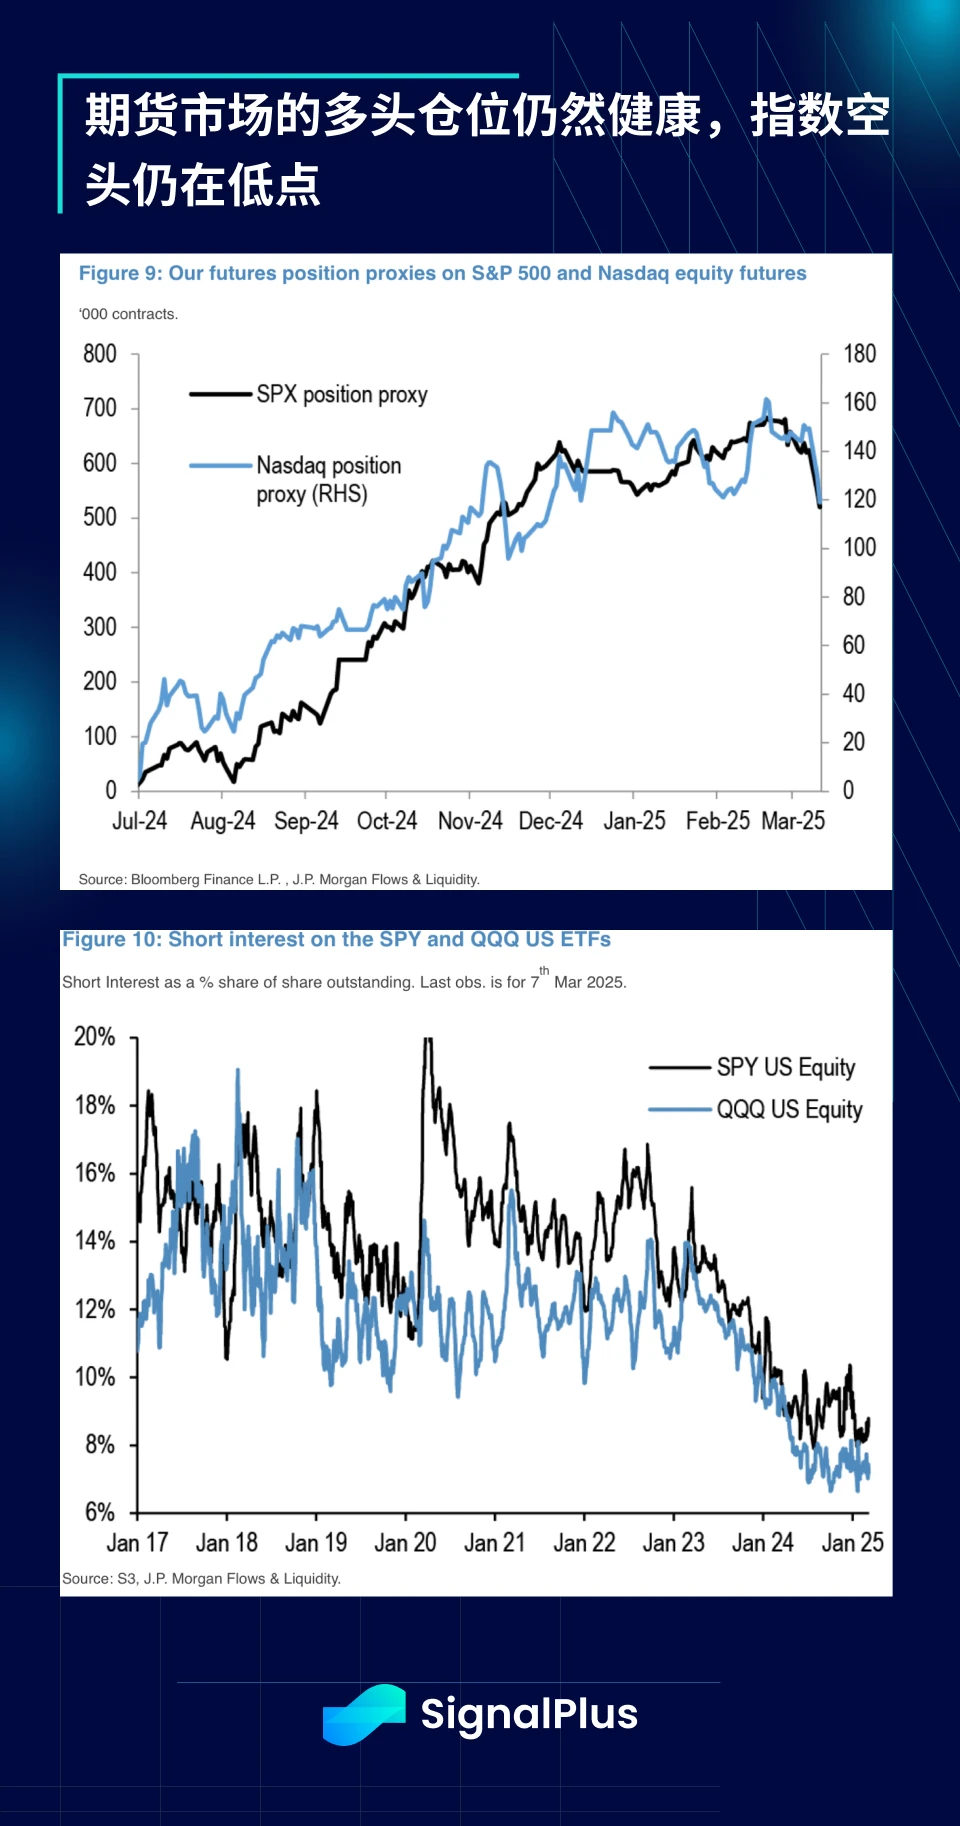
At the same time, although the long positions of futures have declined, they are still high compared with historical levels. In addition, the short positions of SPX and Nasdaq are still at low levels, indicating that the market still lacks short-selling power.
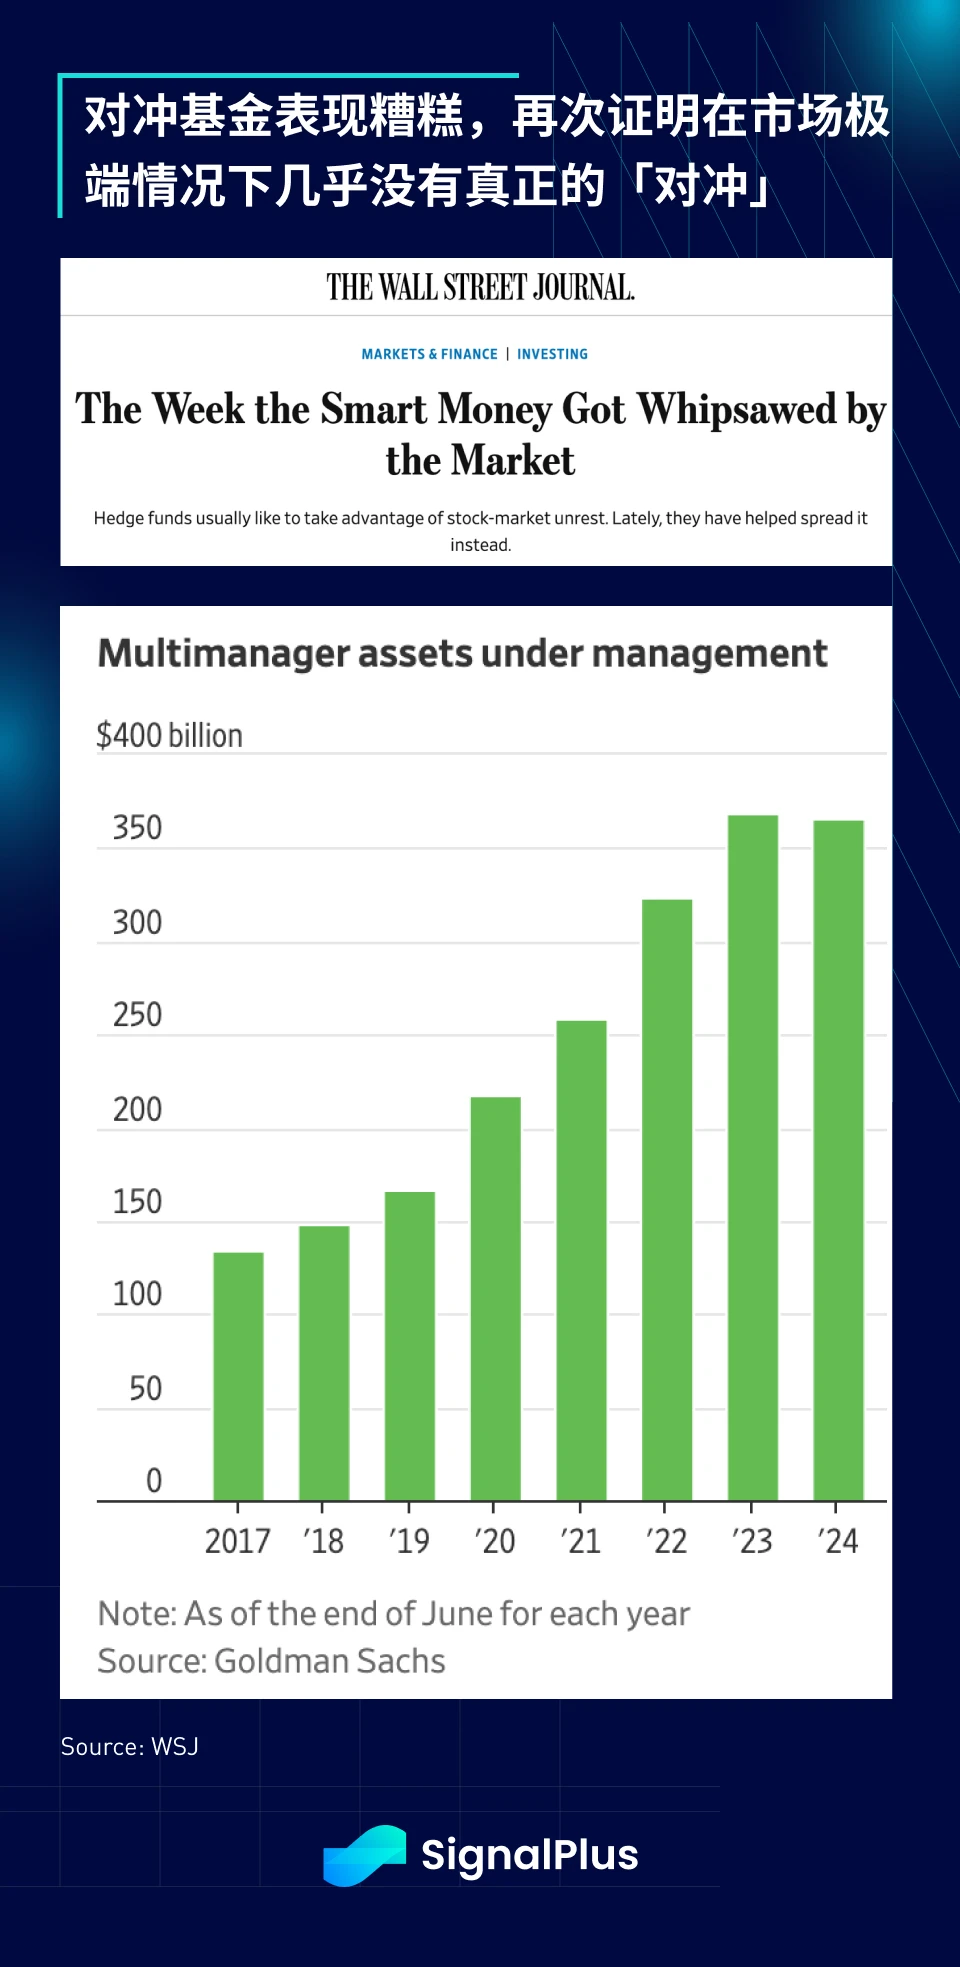
The market believes that this sell-off mainly came from the multi-strategy hedge funds that dominate the entire macro trading market. The Wall Street Journal reported that top hedge funds (Millennium, Point 72, Citadel, etc.) rarely experienced multiple standard deviations of retracements and stop losses in their performance in February and March, which is extremely rare in their long-term trading history.
Markets continued to be volatile on Tuesday. Goldman Sachs sent a report to clients saying that stock-picking hedge funds just experienced their worst 14-day performance since May 2022.
The Millennium fund fell 1.3% in February and 1.4% in the first six days of March, and its two trading teams focused on index rebalancing have lost about $900 million this year. -- WSJ
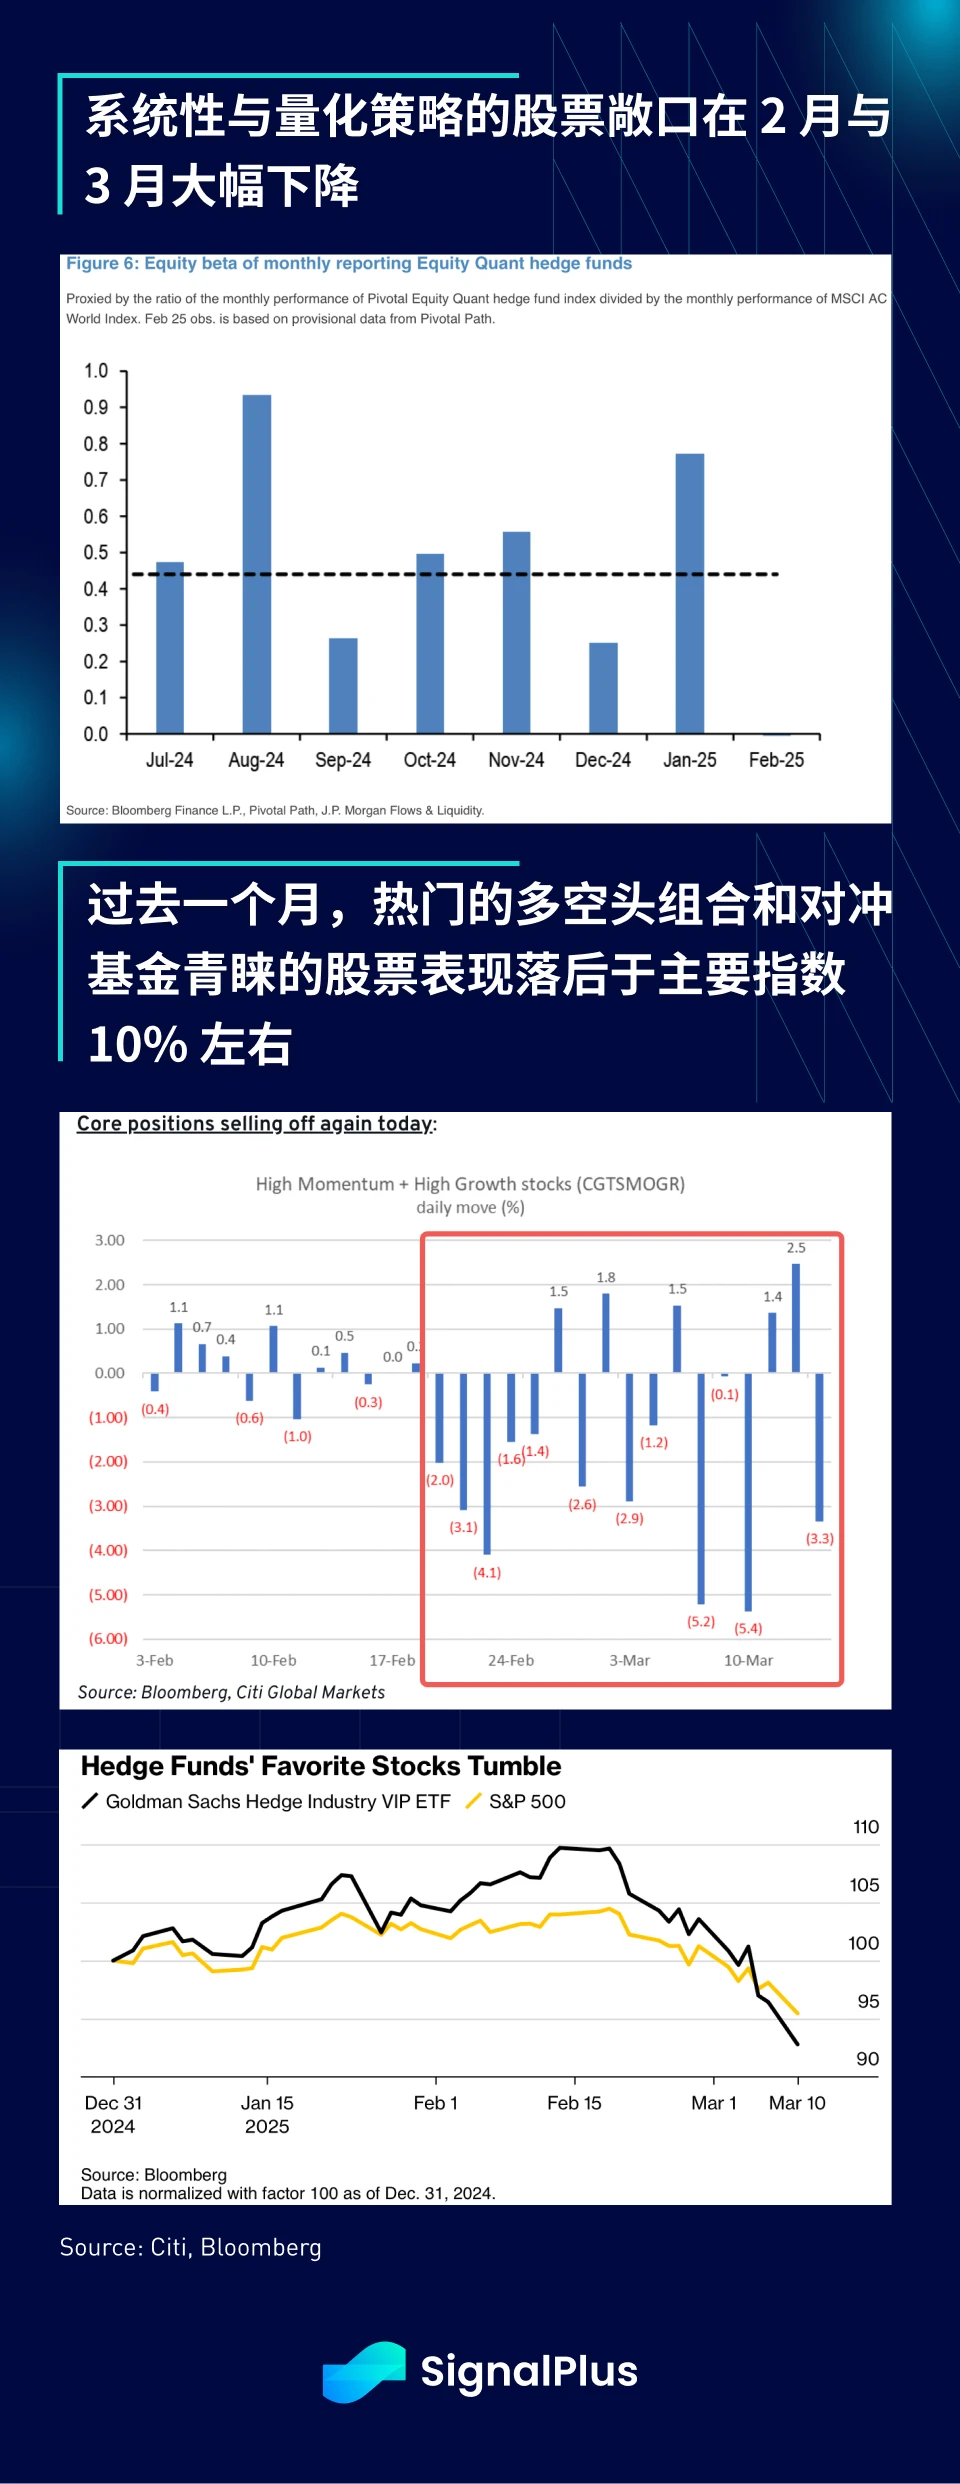
Further supporting this view is data from JPMorgan Chase Co., which shows that equity quantitative hedge funds equity exposure has fallen sharply, with popular long-short strategies in growth and momentum trades suffering, while funds tracking the most popular stocks among hedge funds have underperformed the SPX by about 10% over the past month.
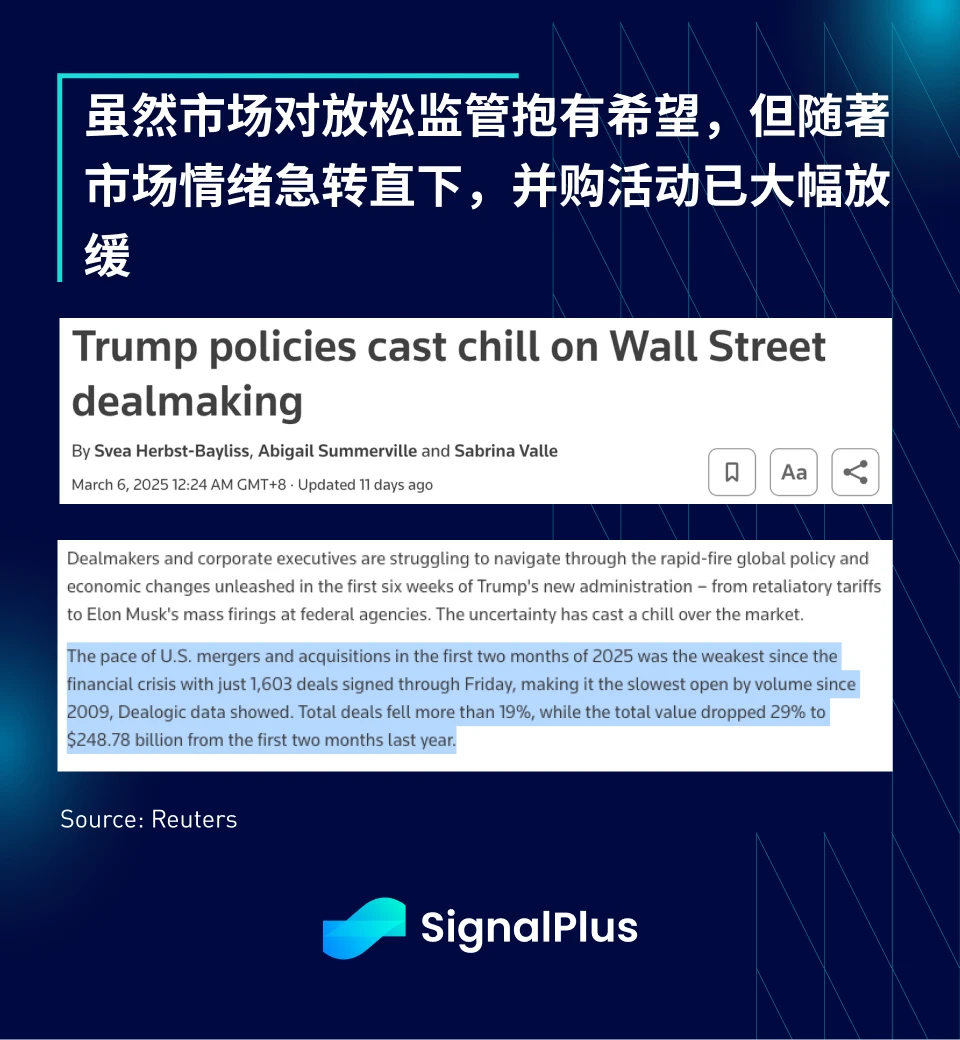
Unfortunately, the pain in the markets isn’t limited to the public markets. Investment banking has also been severely impacted, with merger and acquisition activity slowing to its worst level in more than 20 years due to uncertainty surrounding tariffs.
According to Dealogic data, U.S. MA activity in the first two months of this year hit its lowest level in more than 20 years, with only 1,172 deals completed as of last Friday, with a total value of $226.8 billion. Compared with the same period last year, both the number of deals and the size of deals fell by about a third, marking the slowest start to a year since 2003. -- Reuters
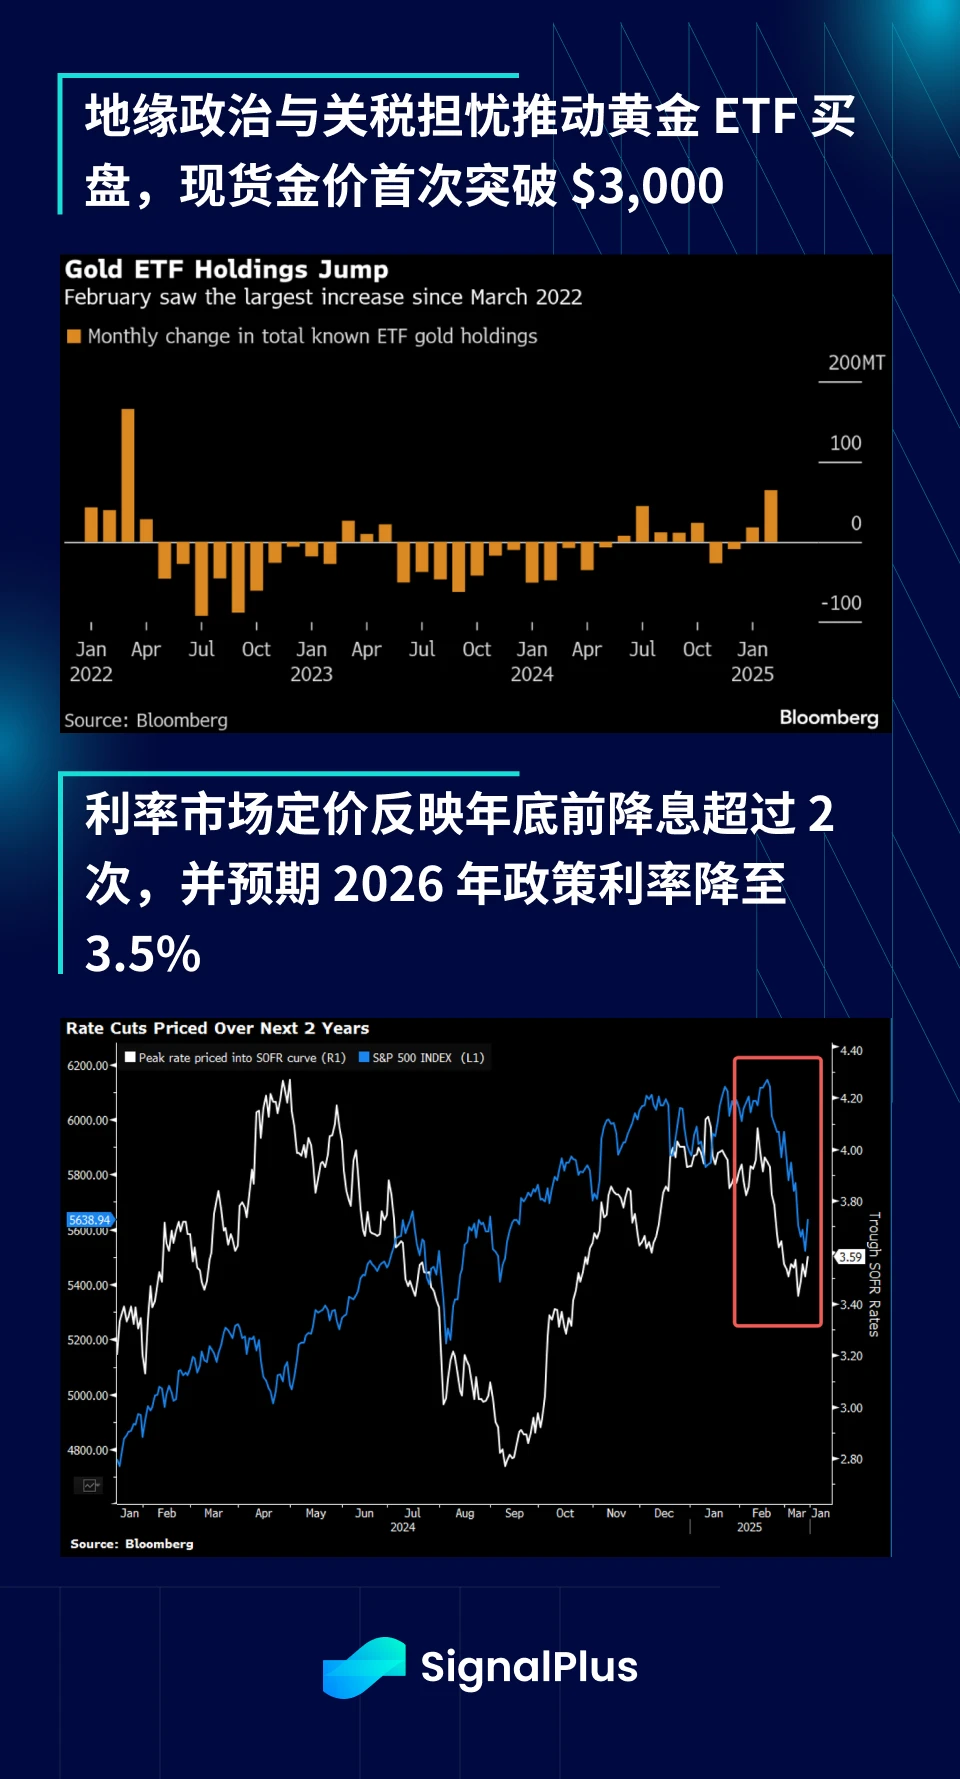
On the other hand, besides gold, (short-term) fixed income is the other major beneficiary of this growth scare. Futures markets are once again re-pricing, predicting more than 2 rate cuts by the end of the year, with overnight rates set to fall to around 3.5% by the end of next year.
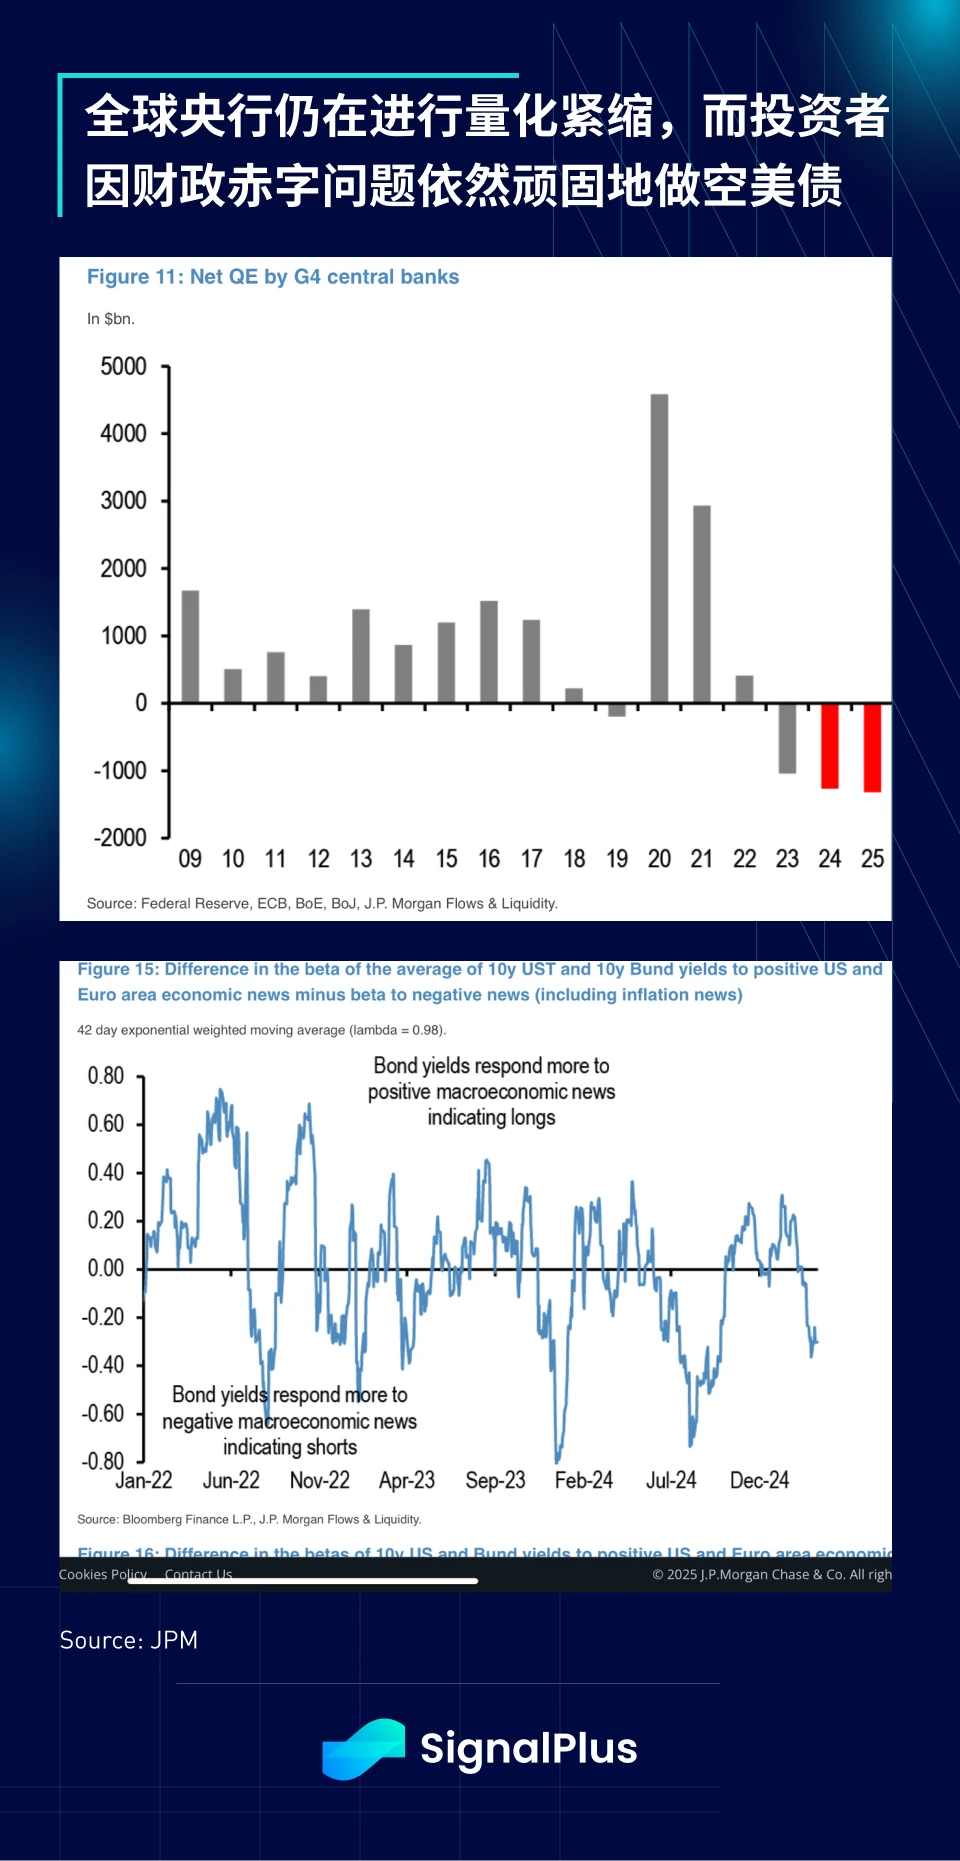
There is no doubt that the continued quantitative tightening and withdrawal of liquidity by global central banks, coupled with market concerns about the US fiscal deficit, have led to a large number of short positions in the US Treasury market, both of which have further driven the recent rebound in the bond market.
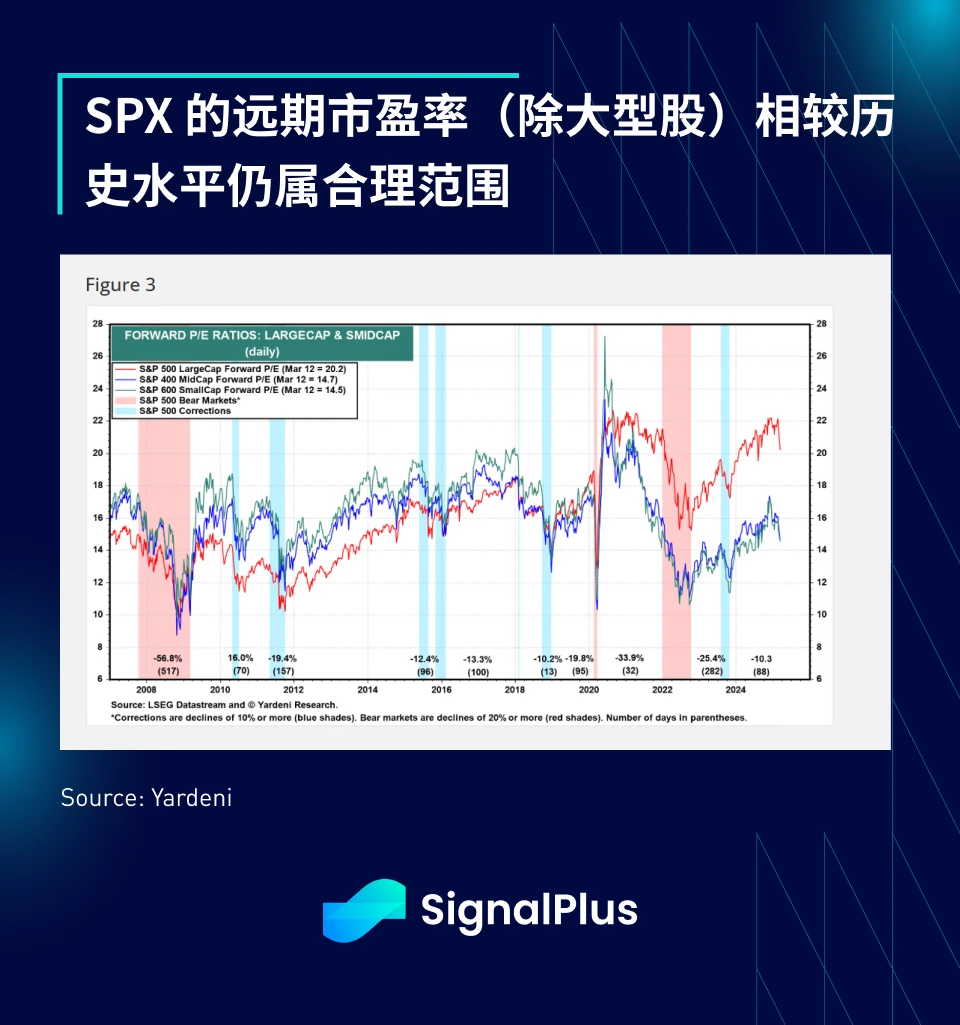
Valuations outside of the major megacaps remain relatively contained compared to historical averages, and while hard economic data is likely to outperform rapidly deteriorating soft data, the consensus view is that this remains a “buy the dip” market as we navigate tariff uncertainty.
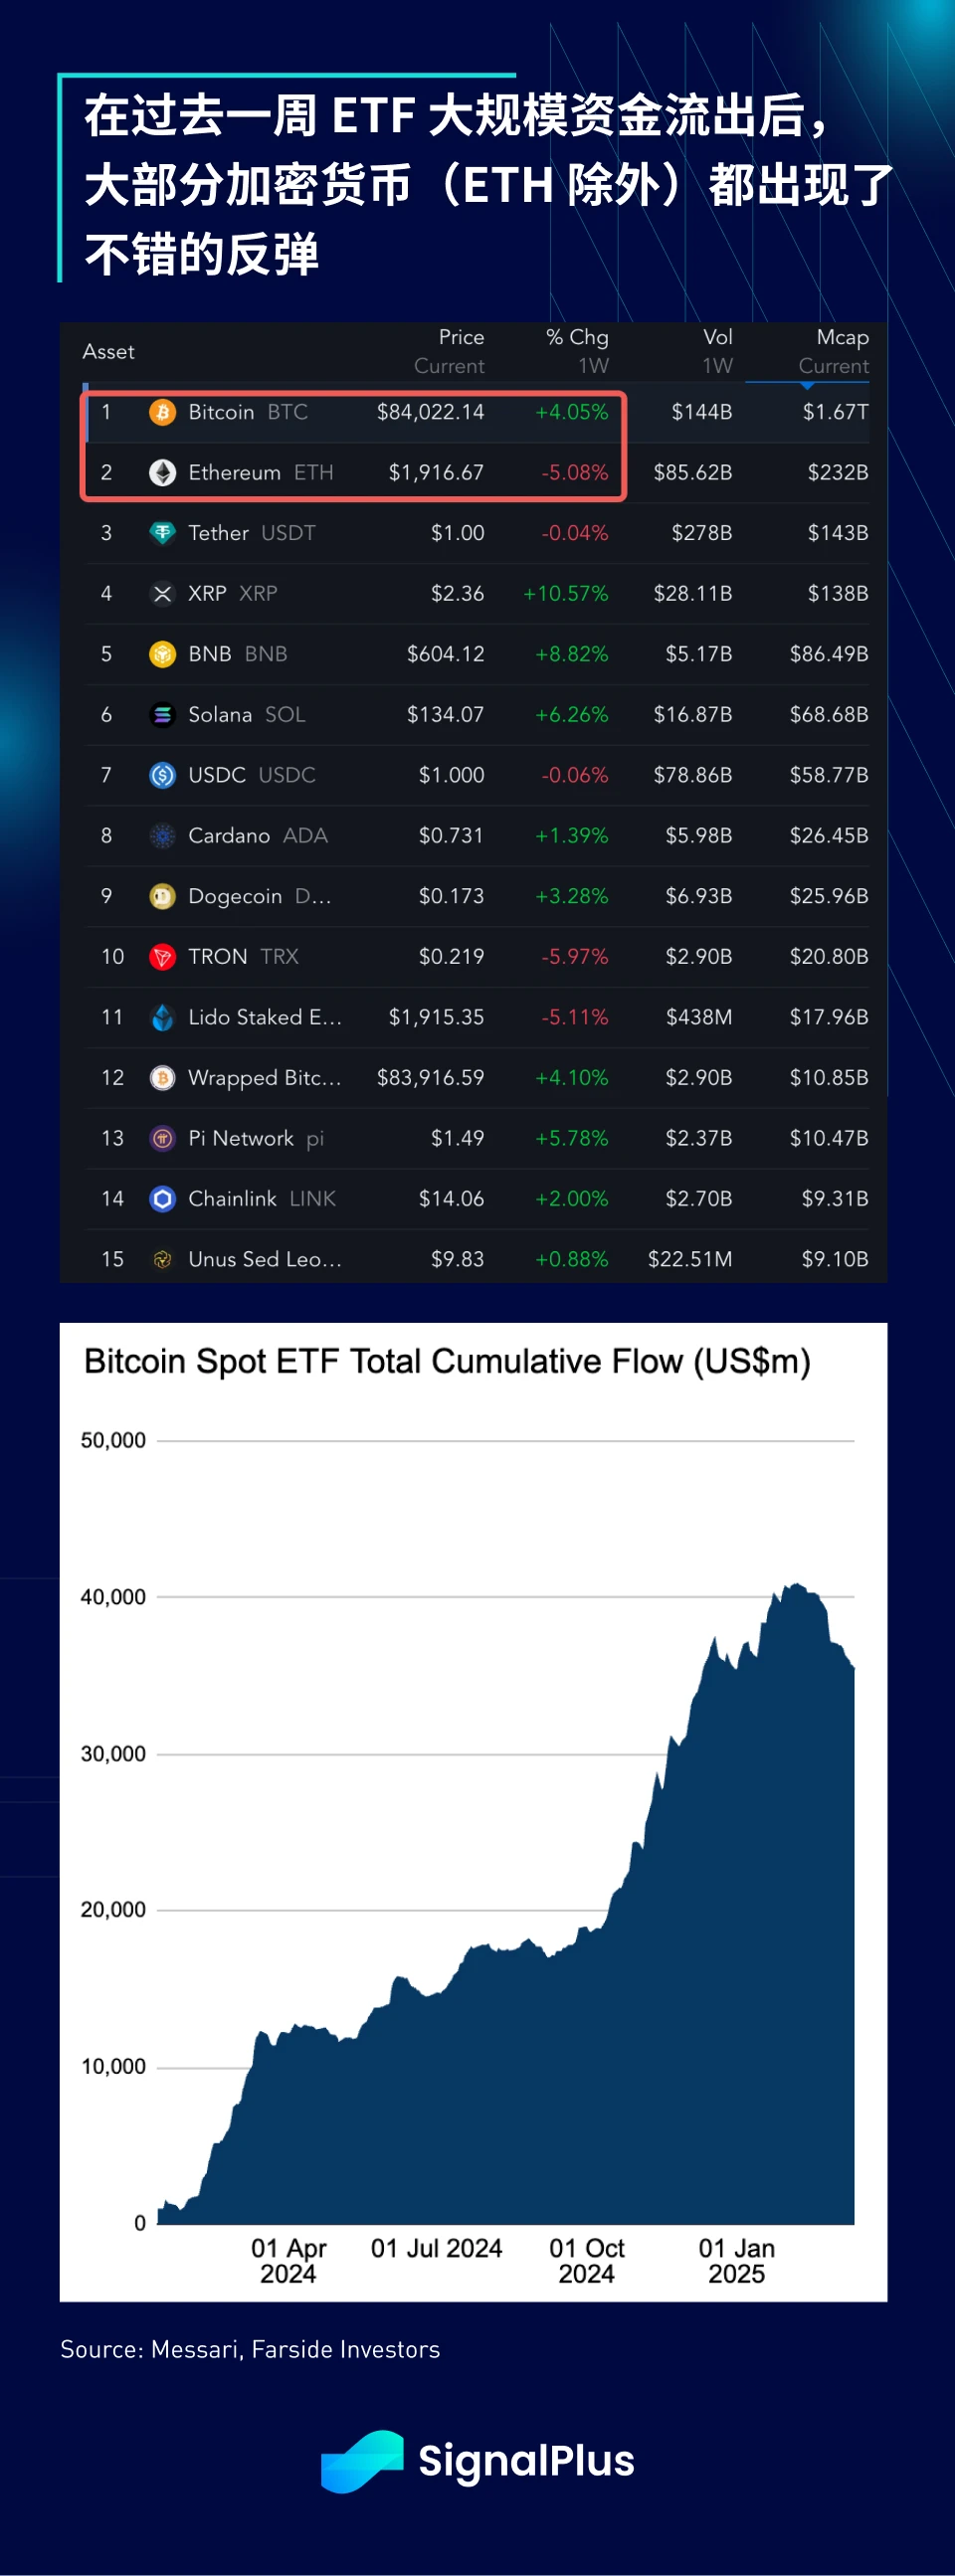
In the cryptocurrency space, market sentiment remains sluggish, with BTC prices hovering around $80K following the disappointing U.S. government strategic reserve plan. However, as market risk sentiment picked up last Friday, altcoins performed better, with Solana (SOL), Chainlink (LINK) and XRP all gaining around 10% in the past week.
BTC ETFs saw record outflows last week, and the market appears to be entering a consolidation range in the short term, and traders have begun hedging downside risks through put options.
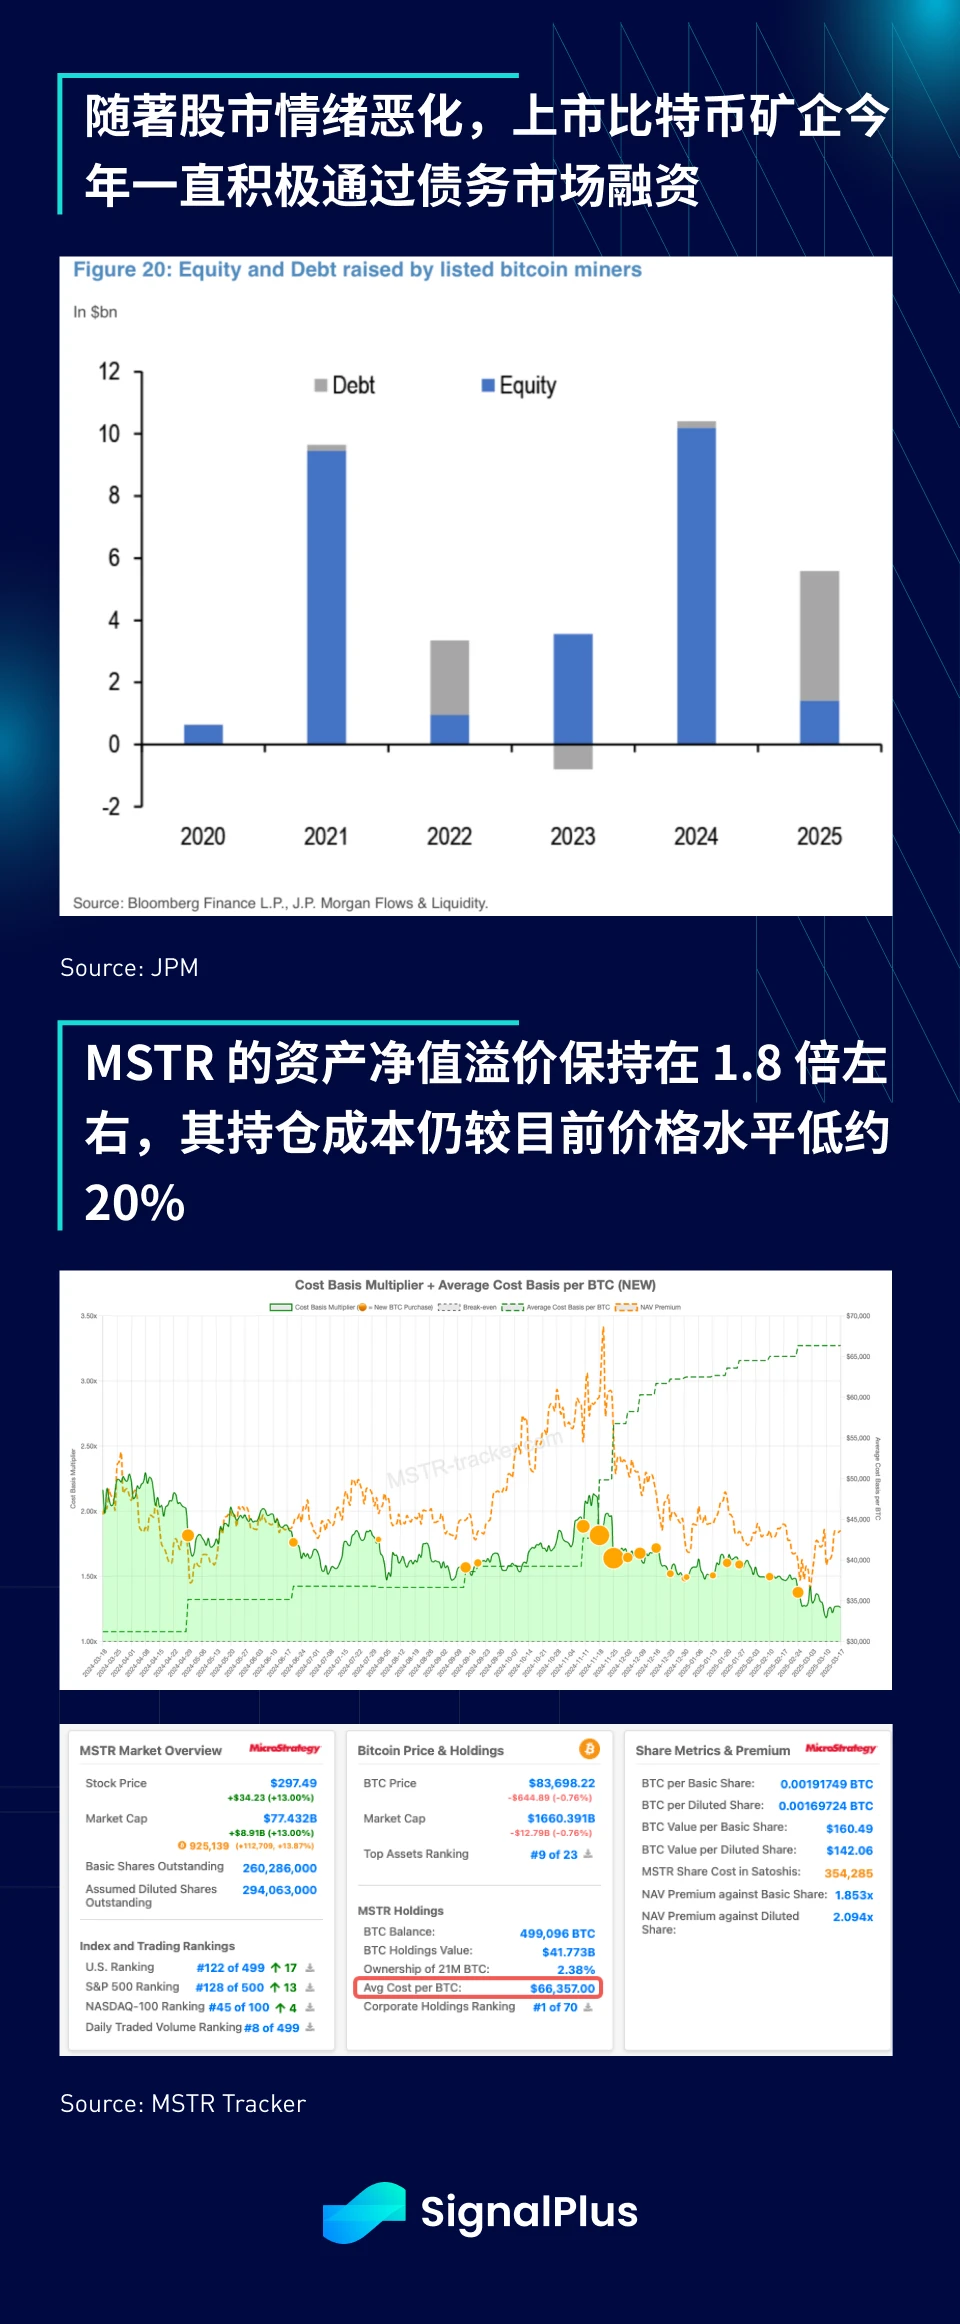
As market sentiment has been affected, listed Bitcoin miners have begun to turn to the debt market to meet their capital expenditure financing needs. For now, as long as financing channels remain open, miners should be able to maintain operations without large-scale sales of BTC, thereby controlling market selling pressure, however, this area still deserves close attention. Currently, MSTRs NAV premium remains at around 1.8 times, and the weighted average BTC holding cost is about $67K, which still has a price buffer of 15-20% over the current market price.
Despite a rebound in risk markets, ETH remains weak, with weekly losses extending again by 5%, lagging BTC by about 10% over the same period. The BTC/ETH ratio fell to 0.023, a level not seen since 2021, when the BTC spot price was only about $35K.

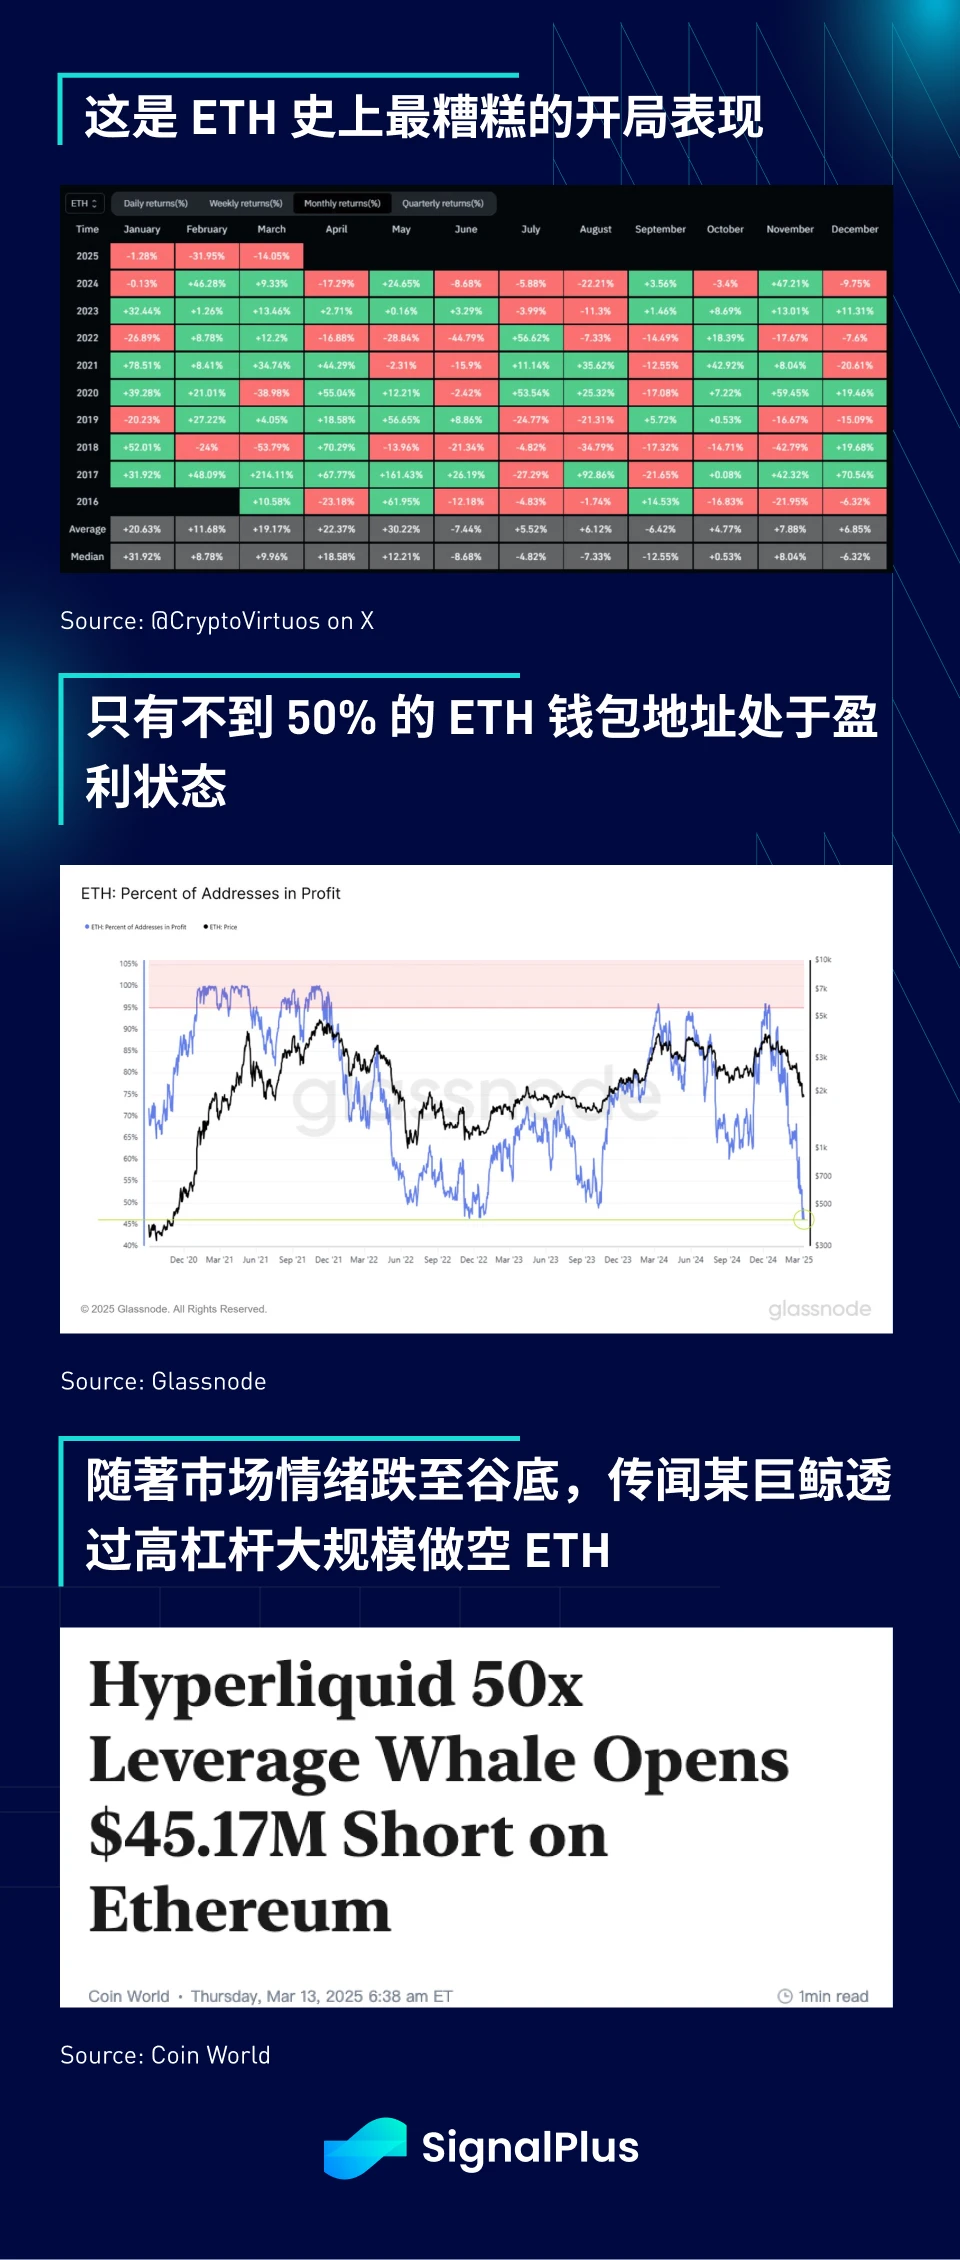
The performance of ETH continues to be dragged down by factors such as cold market sentiment, stop-loss pressure, lack of new narrative drivers, and unresolved Layer 2 value distribution issues. According to Coingecko data, the total market value of stablecoins ($236 billion) has exceeded ETH ($226 billion), as has the total market value of all ERC 20 tokens ($255 billion). Not only that, this is also the first time in the history of ETH that negative returns have occurred in the first three months of the new year. The price has fallen by nearly 48% since the beginning of the year, and less than 50% of active wallet addresses are in a profitable state, and losses are widespread.
Unfortunately, given the current structural problems in the Ethereum ecosystem, it is difficult to expect prices to recover quickly, and there are currently no signs that the Ethereum Foundation will make any major strategic adjustments.
As a saying goes in the market: Keep hitting until morale is boosted - a reminder for everyone to stay vigilant!

You can use the SignalPlus trading vane function at t.signalplus.com to get more real-time crypto information. If you want to receive our updates immediately, please follow our Twitter account @SignalPlusCN, or join our WeChat group (add assistant WeChat, please delete the space between English and numbers: SignalPlus 123), Telegram group and Discord community to communicate and interact with more friends.
SignalPlus Official Website: https://www.signalplus.com


