


summary
• In April, Solana maintained an average of over 93 million transactions per day, reaching a total of 2.8 billion transactions as of April 30, continuing to lead the entire chain.
• Among the capital flow data of various public chains in April, as of April 28, Ethereum recorded a net inflow of over US$904 million, ranking first in the entire network.
• Wallet addresses holding more than 10,000 BTC have a cumulative score between 0.9 and 1, indicating an almost full net buying state.
• The net growth value of BTC UTXO continued to turn positive, indicating a recovery in momentum, with new addresses still maintaining at an average of 300,000 per day, with the rebound mainly driven by existing users.
• As of April 28, a total of 25,207 tokens have been created on the LaunchLab platform, with a graduation rate of approximately 0.84%.
• $TRUMP used a golf dinner and a White House visit to stimulate market enthusiasm, with prices soaring by more than 50%, and on-chain coin holdings and activity growing simultaneously.
On-chain data summary
Overall situation on the chain
On-chain daily transaction volume
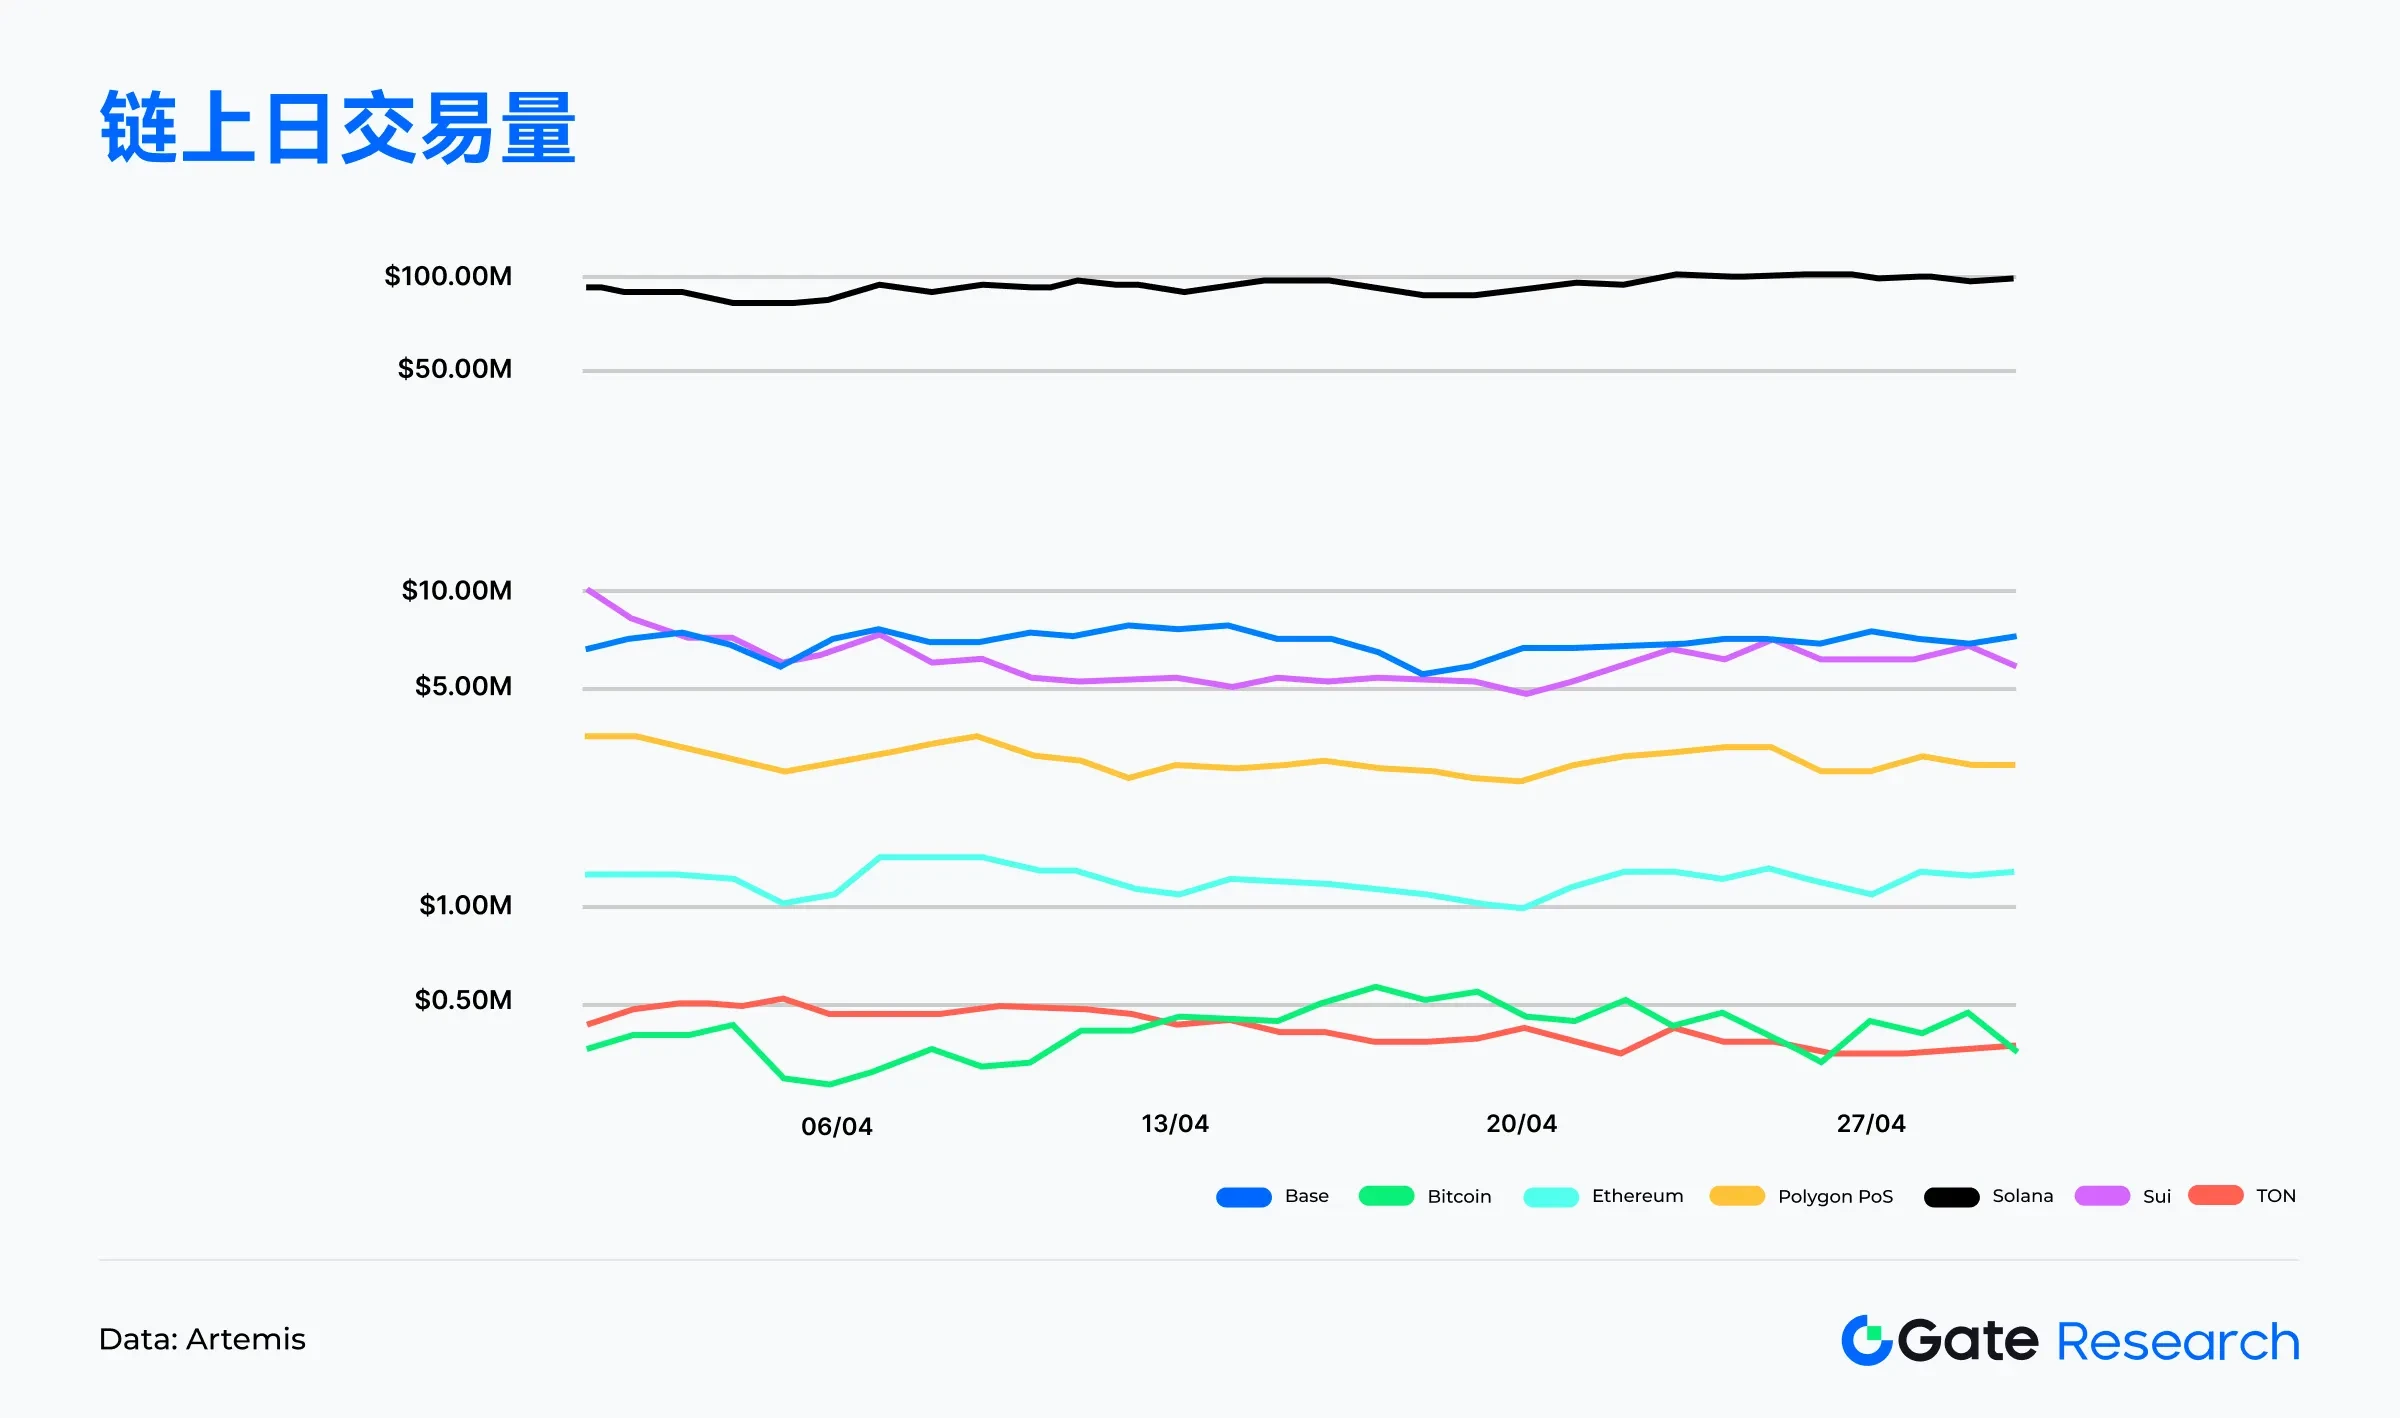
In April, Solana maintained an average of over 93 million transactions per day, and as of April 30, the cumulative number reached 2.8 billion, continuing to lead the entire chain. Base and Sui stabilized in the range of 7 million and 6.1 million transactions respectively, showing strong activity. Polygon PoS and Ethereums daily transaction volumes were over 2.9 million and 1 million, respectively, with a relatively stable trend. TON and Bitcoins transaction volumes were relatively low, basically maintaining between 200,000 and 400,000 transactions.
Overall, Solana ranks first, while the emerging chains Base and Sui, although still small in scale, have frequent interactions and strong ecological momentum. Benefiting from the support of the Coinbase ecosystem and the active promotion of Meme coins, Base not only has an average daily transaction volume of more than 7 million transactions, but also recorded an average daily gas income of nearly US$350,000 in mid-April, showing its commercialization potential. Sui, relying on the advantages of Move language development and support from use cases such as games and NFTs, has an average daily transaction volume of 6.1 million transactions and maintains high-frequency interactions. Both are rapidly expanding in a low-fee, highly interactive on-chain environment, becoming the most promising emerging public chain representatives. [1]
Daily Gas Fees for Each Chain
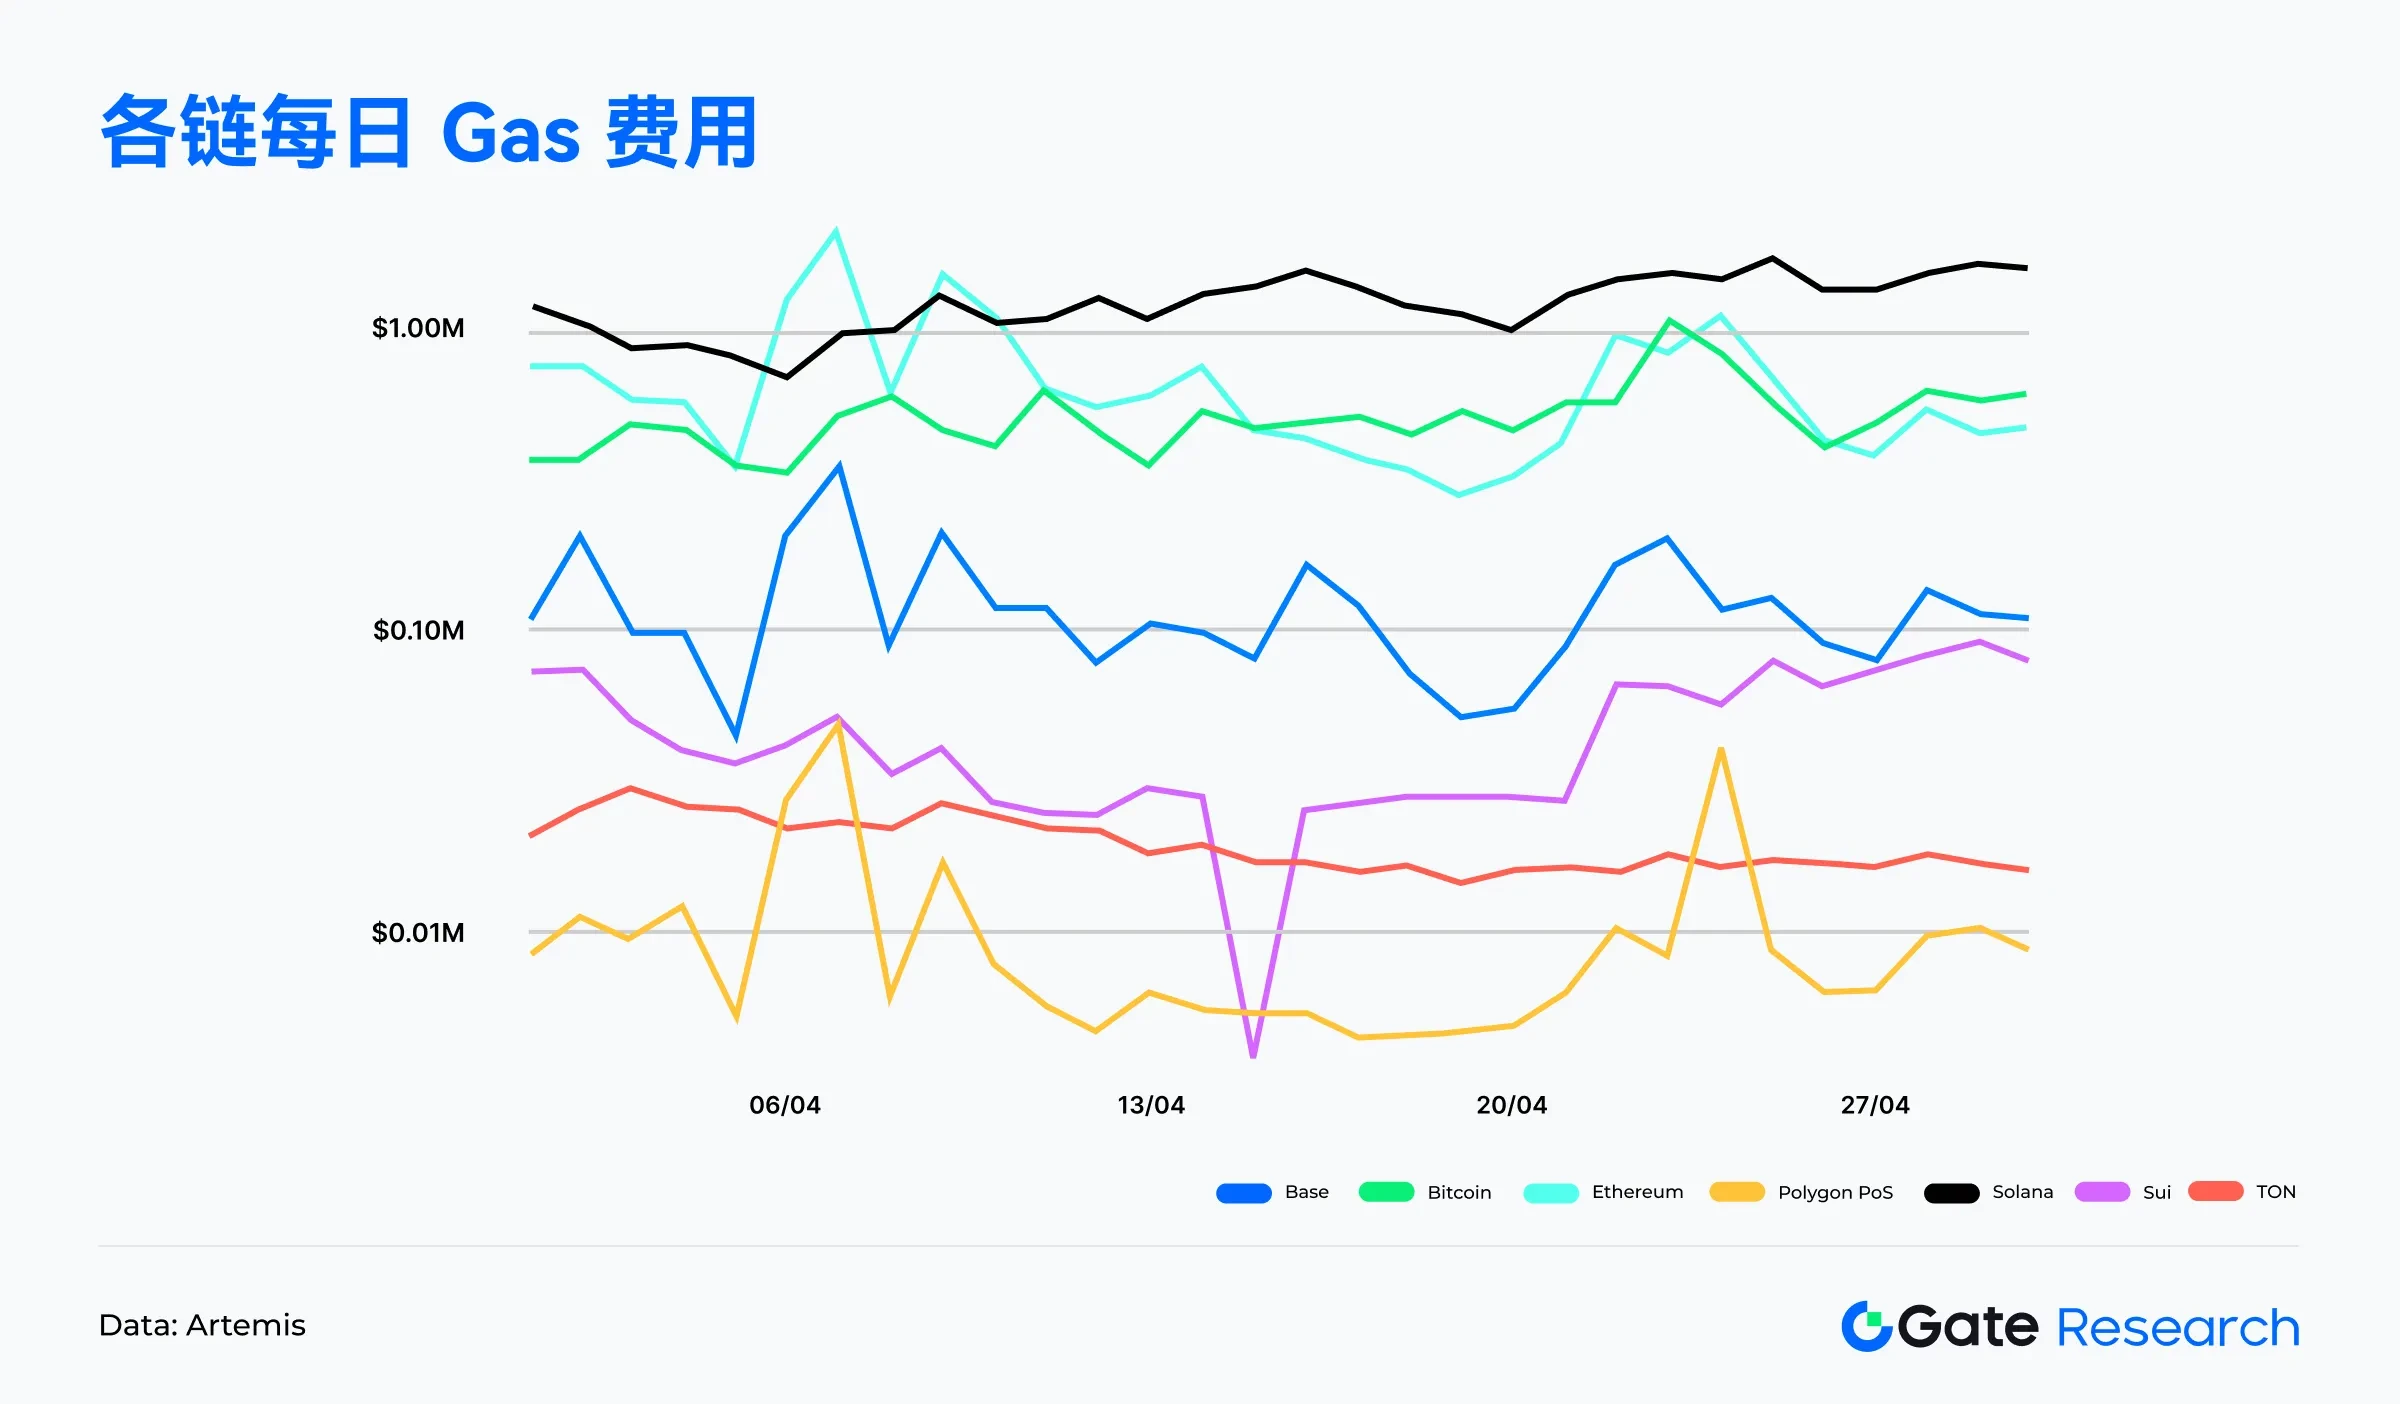
During April, Solana continued to lead in gas revenue, with an average daily fee of over $1.2 million, and a total of $37.5 million as of April 30. Bitcoin and Ethereum followed closely behind, with average daily revenues ranging from $500,000 to $700,000. Base once soared to nearly $350,000 in the middle of the month, with outstanding performance. Sui, Polygon PoS and TONs average daily fees are still below $50,000, remaining at a low level. Overall, the leading chains continue to lead in fee revenue, while emerging chains such as Base have gradually demonstrated commercialization potential. [2]
Solana’s user base and ecological driving force behind high-frequency interactions
During April, Solana not only maintained an average of 93 million transactions per day, but also maintained daily active addresses above 4 million, with a monthly average of about 4.5 million, showing that trading activity is not driven solely by robots or a single protocol, but is built on a broad user base. In particular, on April 11, the number of active addresses exceeded 6.2 million, further highlighting the concentrated outbreak of ecological heat.
In addition, Solanas average daily gas revenue exceeds $1.2 million, far higher than most public chains, indicating that on-chain transactions are not only frequent, but also have real handling fee support, not zero-cost brushing. This trend is closely related to MEV reward mechanisms such as Jito. A large number of high-frequency traders and arbitrage robots are active on the chain, driving up fees. Meme coin issuance platforms such as Pump.fun continue to attract creators to flow in, and the volume of swap operations supported by aggregated trading platforms such as Jupiter has kept on-chain interactions at a high level for a long time. [3]
Public chain bridge net flow
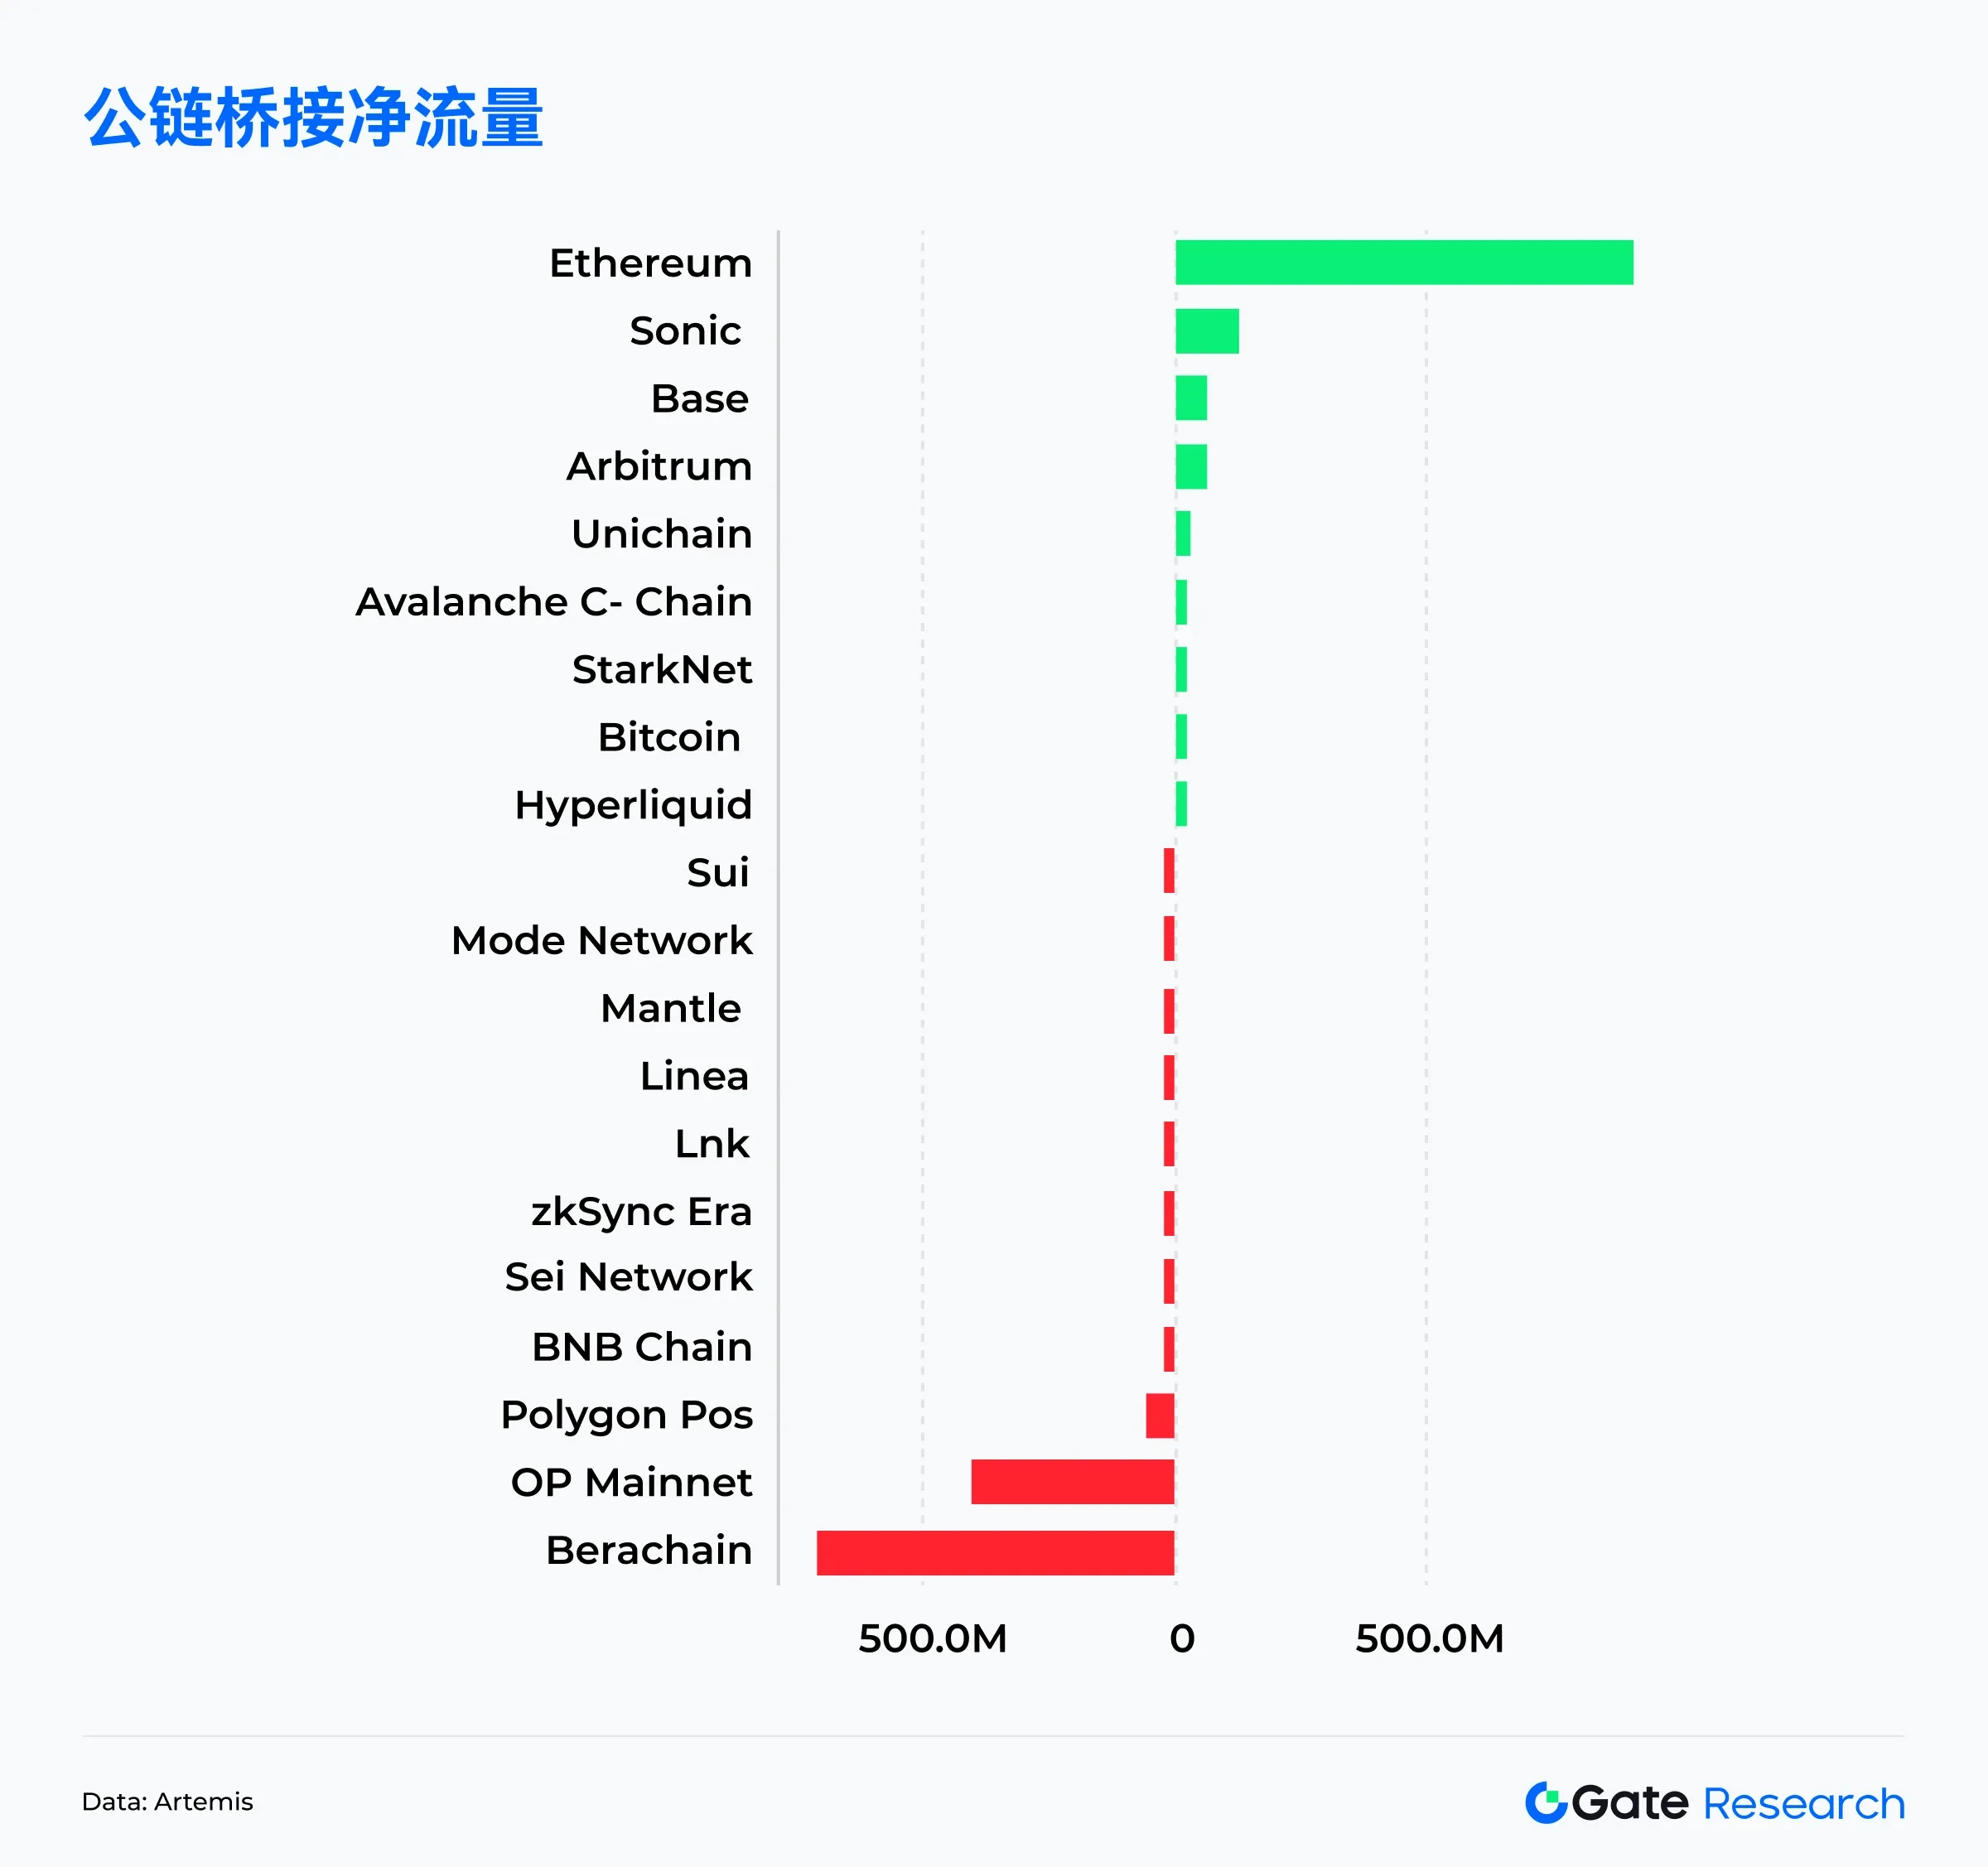
In the data of fund flows of various public chains in April, as of April 28, Ethereum recorded a net inflow of over US$904 million, ranking first in the entire network, reversing the trend of continuous fund outflow in the first three months and re-establishing its core position as a value deposit place. This reflux trend may be related to the macro background such as the recovery of market risk appetite, the stabilization of L2 chain activities, and the rise in ETF expectations, which attracted long-term capital to return to the main chain.
Among the emerging public chains, Sonic performed well, attracting more than $124 million in net inflows in a single month, ranking second on the list, reflecting that its high-performance architecture and low-cost transactions have attracted new capital attention, and its ecological growth potential has been recognized by the market. At the same time, Base and Arbitrum recorded net inflows of approximately $64.8 million and $62.1 million respectively, indicating that some L2 networks still maintain a net inflow of funds, benefiting from a stable developer base and user growth. Small ecological chains such as Sui and Hyperliquid maintain a small net inflow, reflecting that they still have the ability to attract money in vertical scenarios (such as transactions and games).
In contrast, Berachain saw a net outflow of $704 million, the largest among all chains. OP Mainnet and Polygon PoS also saw outflows of $400 million and $57 million respectively, indicating that some funds were transferred to other public chains or off-chain markets in the short term. Overall, capital flows rebounded structurally in April, with Ethereum making a strong comeback and Sonic emerging as a dark horse, while some early hot projects faced pressure to reallocate funds, and the competitive landscape of public chains is quietly changing. [4]
Bitcoin key indicator analysis
The following will screen and analyze several key Bitcoin indicators and summarize the market trends accordingly.
Bitcoin buying trends by holding size: Large funds continue to buy, and rebound signals are clear
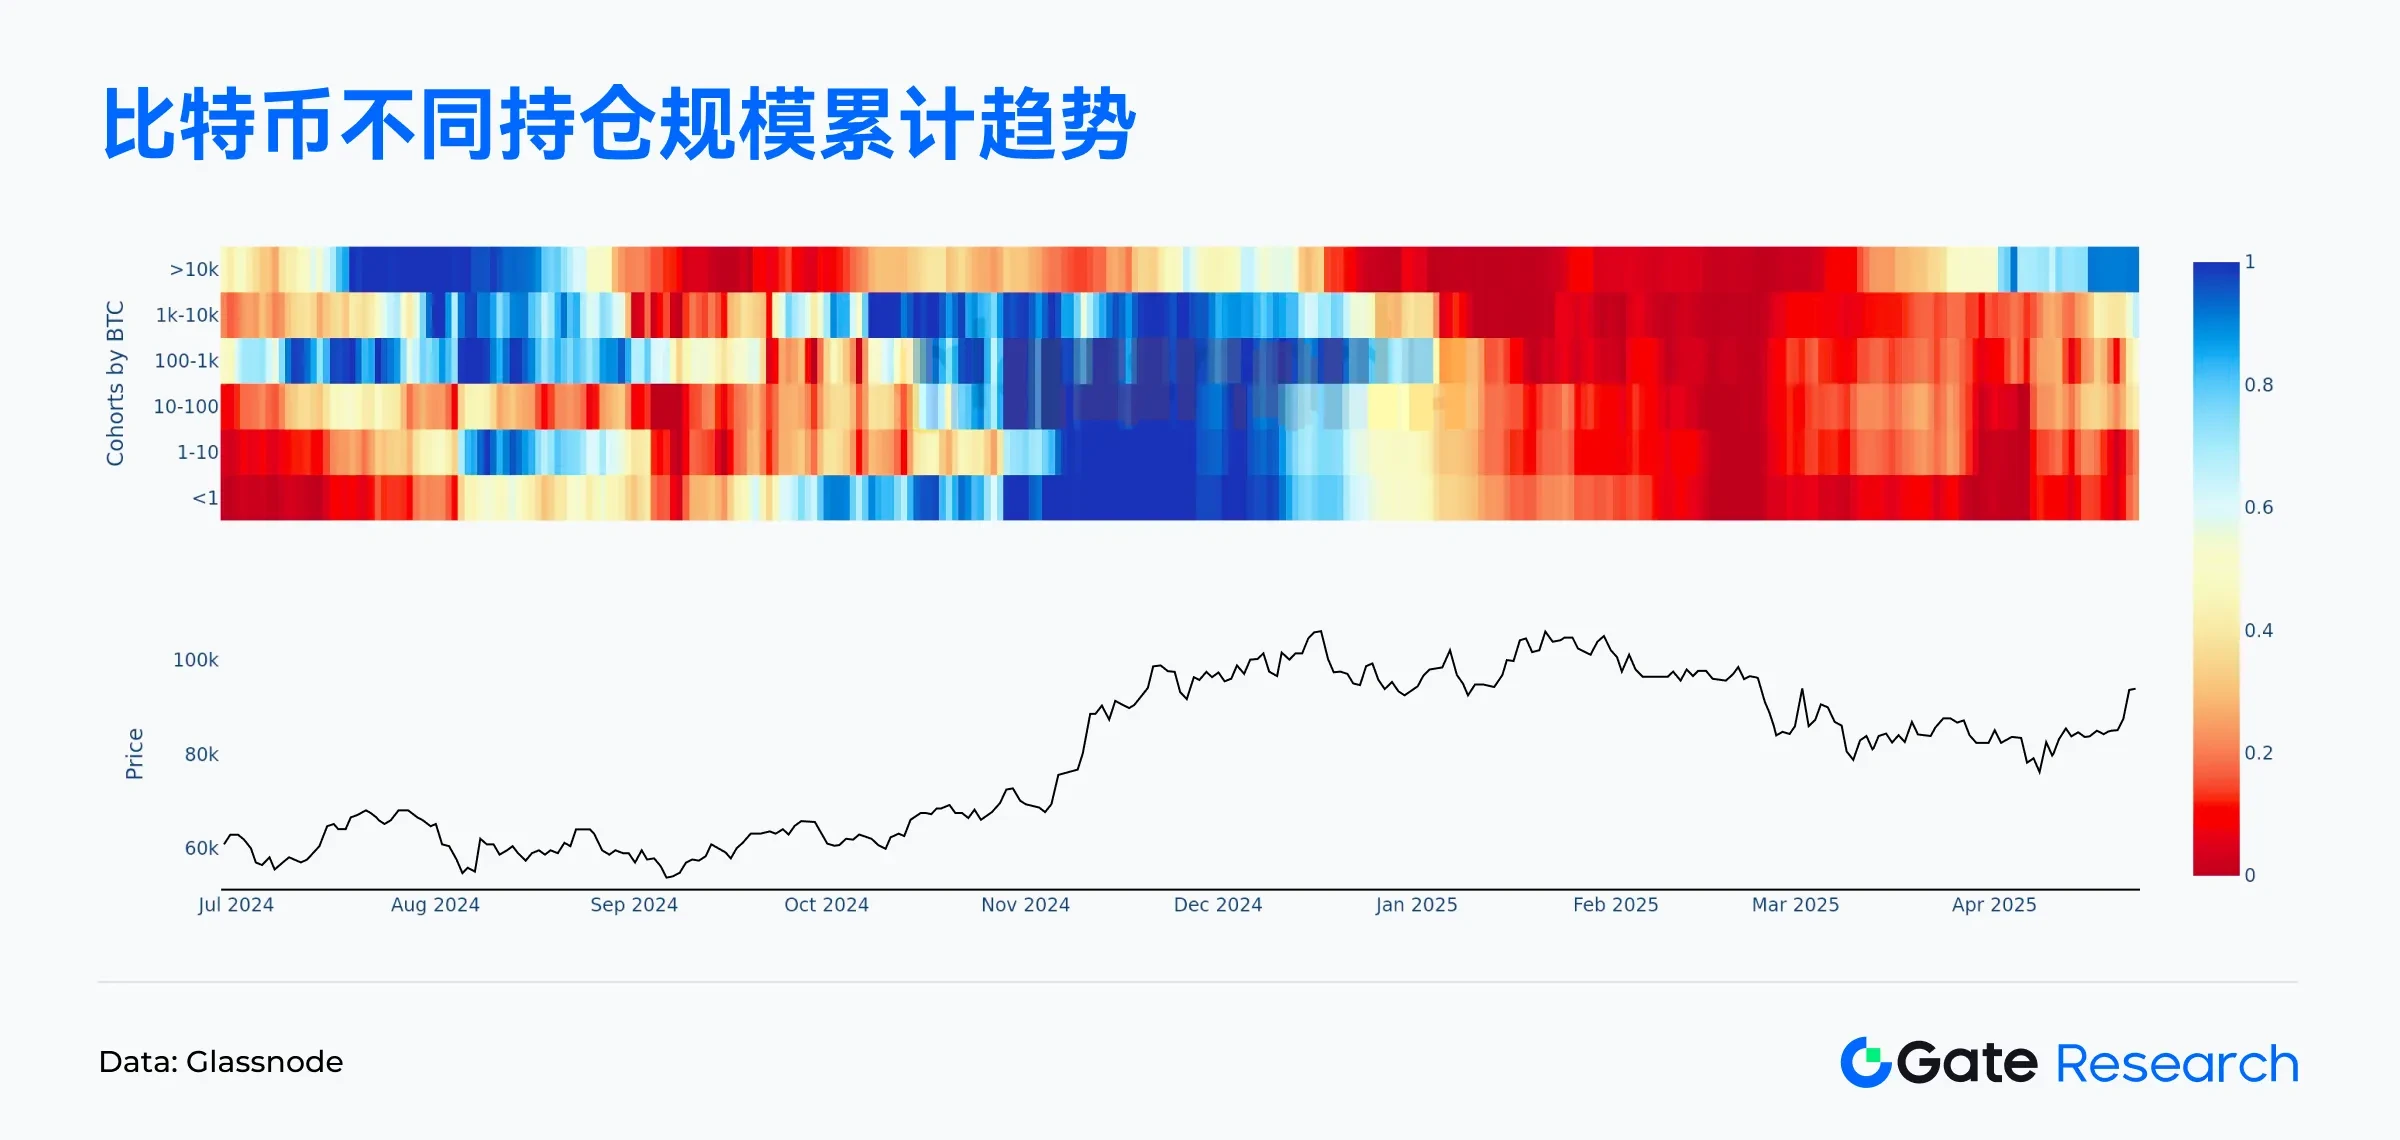
According to Glassnode data, during the recent Bitcoin price recovery, large fund holders have clearly shown a continuous buying behavior:
• Wallet addresses holding more than 10,000 BTC have a cumulative score between 0.9 and 1, indicating an almost full net buying state.
• Addresses holding between 1,000 and 10,000 BTC have a cumulative score between 0.7 and 0.8, indicating that this group is actively accumulating.
• For medium-sized holders holding 10 to 1,000 BTC, the cumulative score has rebounded to around 0.5, indicating a shift from neutral to a buying bias.
This means that during the rebound of Bitcoin prices since the mid-April correction, large funds (whales) have entered the market first and continued to absorb chips, driving the gradual recovery of market confidence. Such funds have always had a significant impact on price trends, and their concentrated position building behavior is usually regarded as an important signal of medium- and long-term rise. [5] [6]
UTXO net growth turns positive, Bitcoin on-chain activity picks up
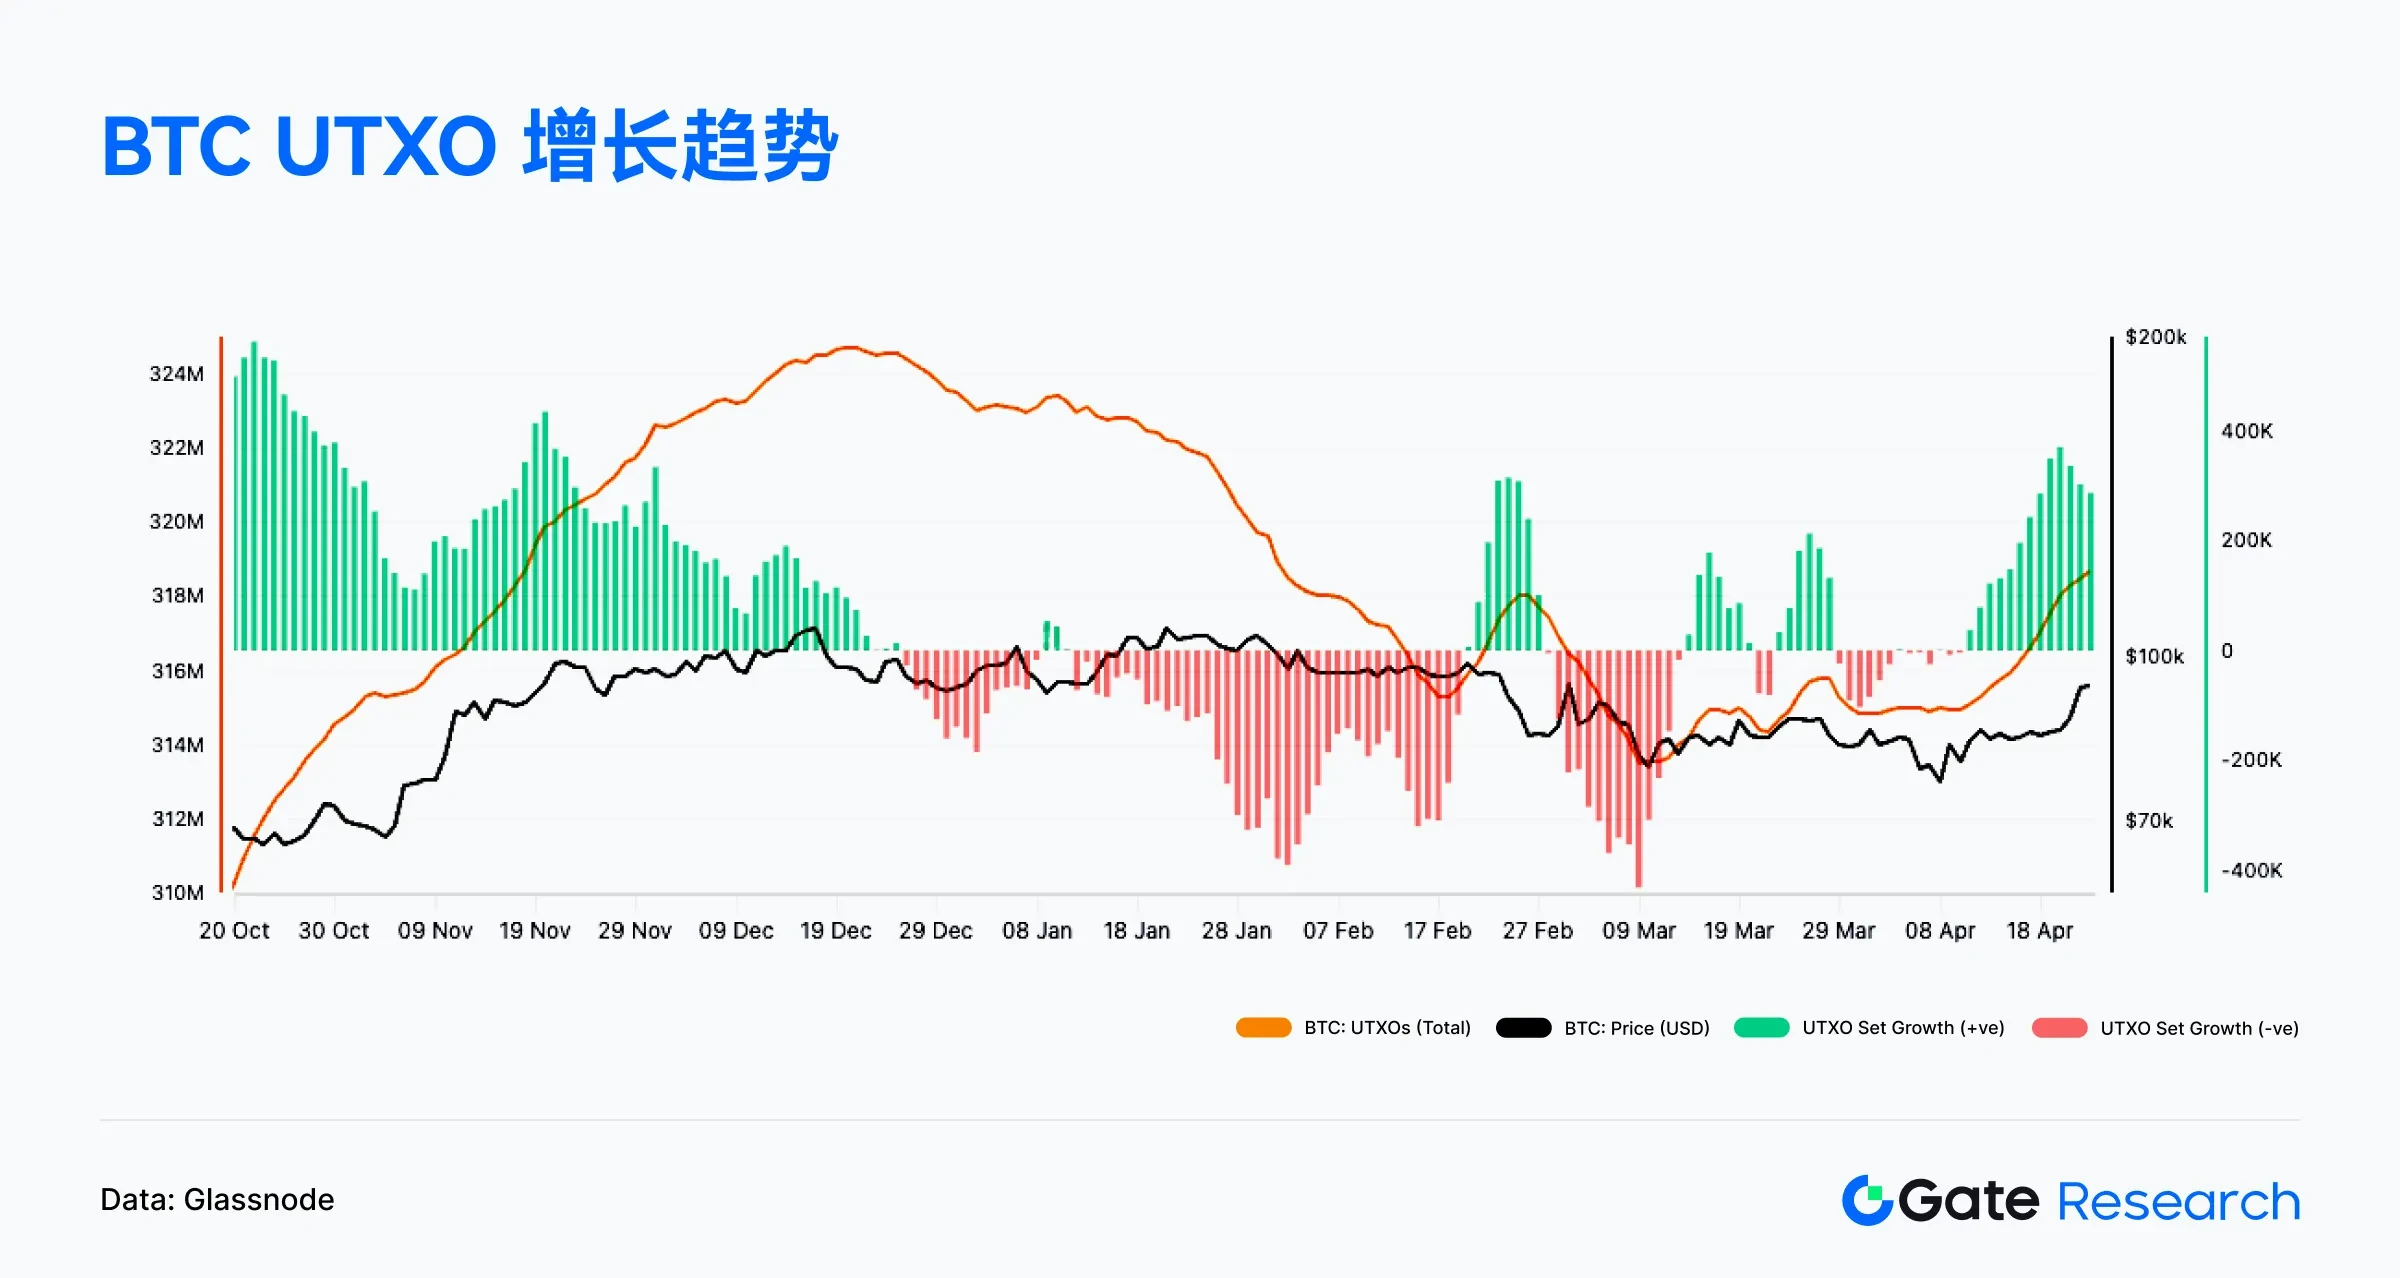
UTXO (Unspent Transaction Output) is the most basic unit of account in Bitcoin. It can be regarded as change that has not been used yet. It is controlled by the private key of the corresponding address until it is used for the next transaction. Its mechanism ensures the transparency and traceability of the blockchain and is the core of Bitcoins decentralized structure. The change in the total number of UTXOs reflects the activity on the chain. An increase usually indicates an increase in transaction frequency, an increase in new addresses, or a dispersion of funds, which represents an active network; a decrease may indicate transaction consolidation, a decrease in users, or a wait-and-see market, reflecting a slowdown in network usage.
According to Glassnode on-chain data, since April 11, the UTXO net growth value has continued to turn positive, and the green column has increased significantly, indicating that network activity is gradually recovering and on-chain transactions are becoming more frequent. At the same time, the total UTXO volume has also begun to recover, echoing the rising trend of Bitcoin prices, indicating that the market may be experiencing a new growth cycle or is in the early stages of recovery. This indicator provides an important reference for on-chain capital flow and user participation, and is often regarded as a leading signal for judging market heat and on-chain health. [7]
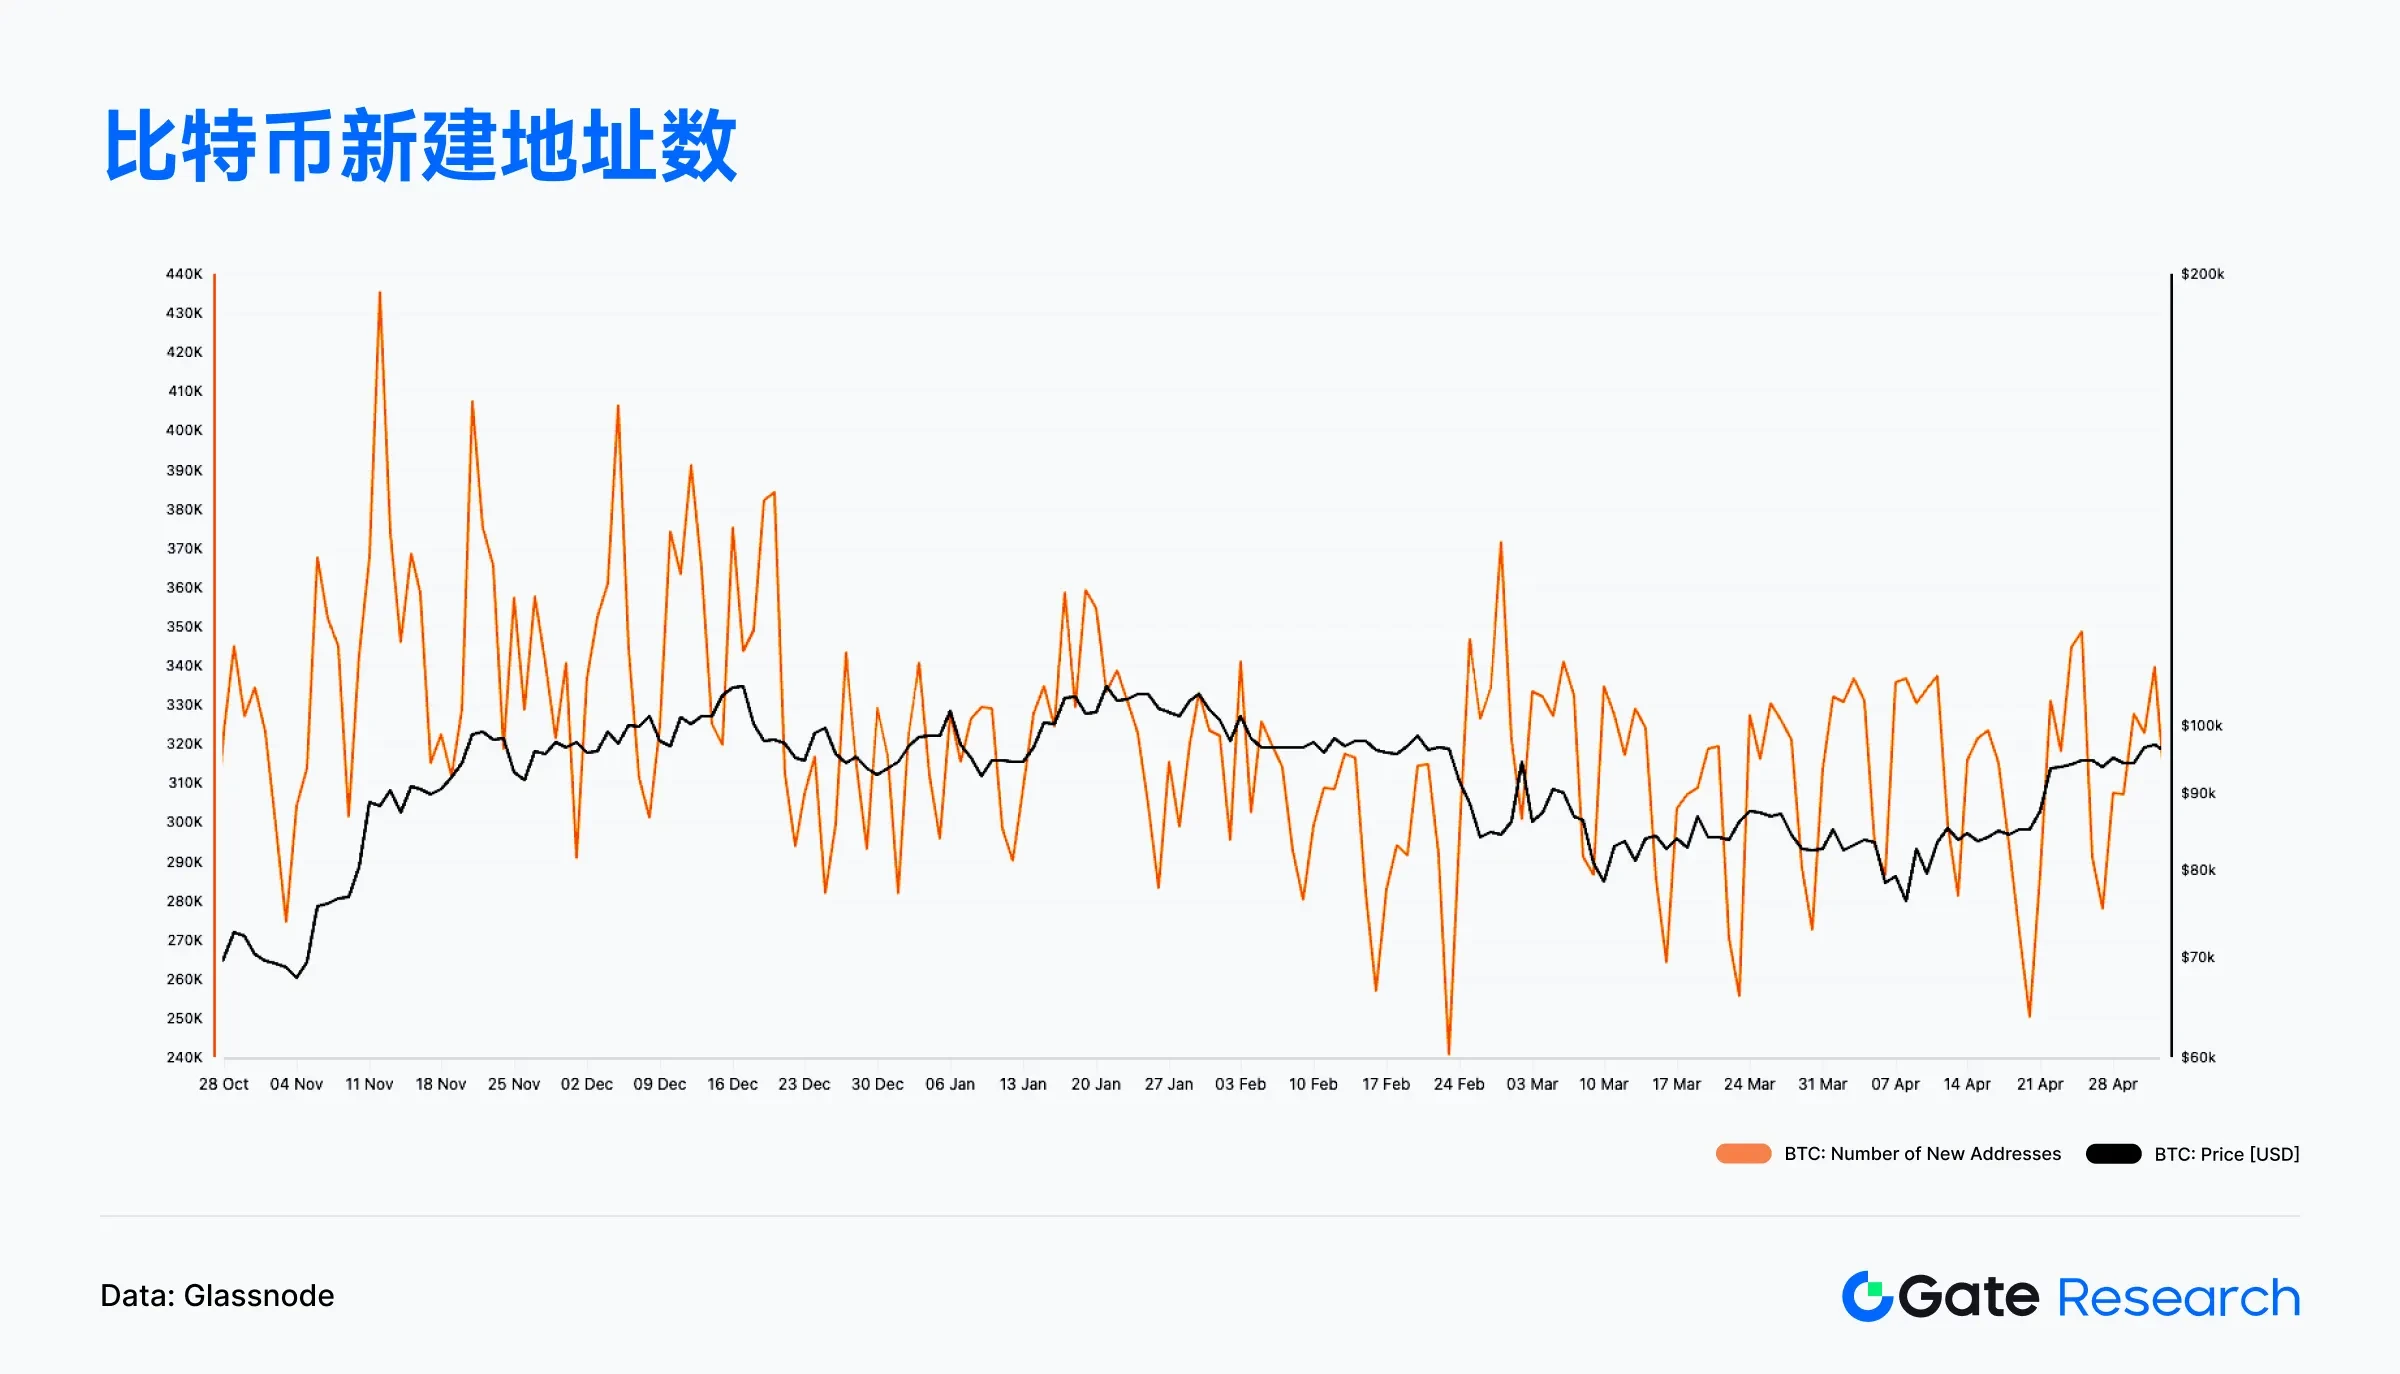
It is worth noting that although UTXO turned to positive growth in April, reflecting the increase in on-chain transaction activity, the number of new addresses did not see a significant increase. According to Glassnode data, the number of new addresses in April remained roughly in the range of 300,000 to 350,000 per day, lacking a significant breakthrough, indicating that this round of on-chain recovery is more due to the return of existing users and the increase in transaction frequency, rather than the entry of new investors.
This structural feature indicates that the current market is still in a repair phase dominated by existing users, and new users have not yet formed a trend of expansion. Although the overall on-chain indicators are positive, in order to support longer-term price increases, it is still necessary to continue to pay attention to whether the number of new addresses increases synchronously with the price increase to verify whether the market has entered a new stage of incremental capital drive. [8]
The proportion of Bitcoin profitable addresses has risen to 93%, and market sentiment has warmed up
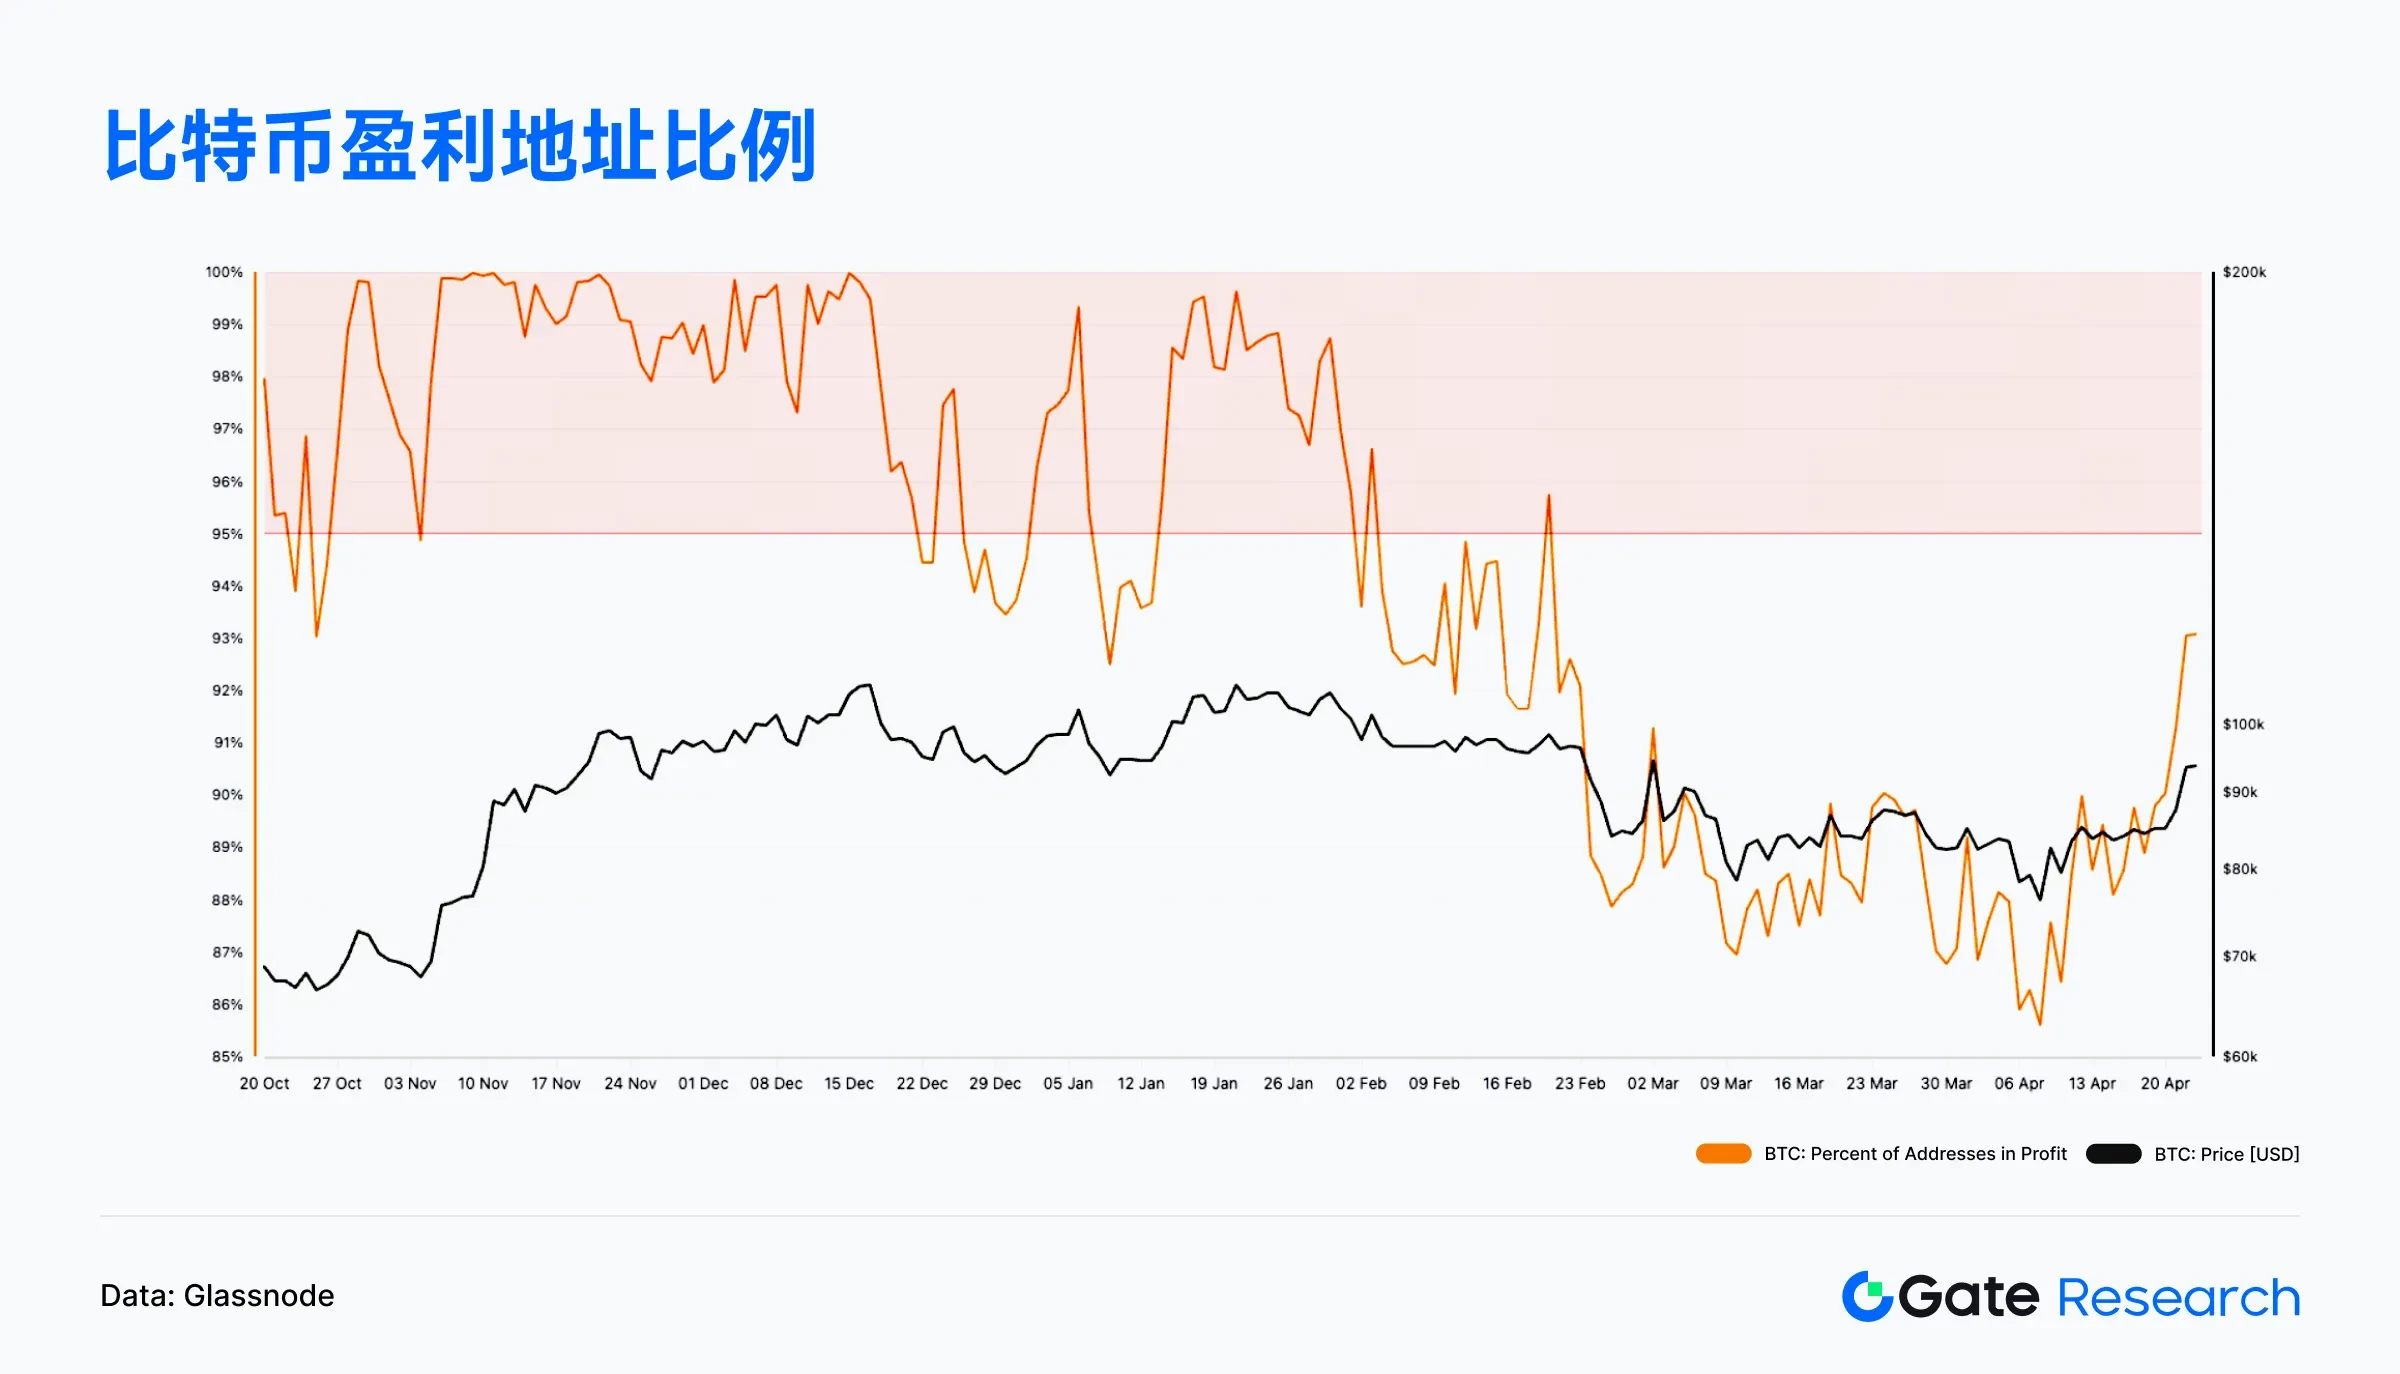
While existing users are returning and increasing the frequency of interaction, market sentiment is also gradually warming up as prices rebound, which can be further observed from the changes in the proportion of profitable addresses. According to Glassnode data, during the recent Bitcoin price rebound, the proportion of profitable addresses on the chain has also increased. This indicator (Percent of Addresses in Profit) represents the proportion of addresses whose current coin price is higher than the average purchase price of the address, which can be used to measure the overall profitable state of holding coins in the market.
From the chart, we can see that since the price of Bitcoin rose in mid-April, the ratio has rebounded rapidly and has now reached 93%. This means that most investors have returned to profitability and the pressure of floating losses caused by earlier adjustments is rapidly easing. This trend usually indicates that market sentiment is shifting from pessimism to neutral or even bullish, which not only helps to stimulate new buying momentum, but may also be accompanied by some profit-taking. If prices continue to run at high levels and drive the proportion of profitable addresses to further increase, the market may enter the early stages of a new round of upward cycle. [9]
Market Trend Summary
In April, the performance of the on-chain ecosystem was differentiated. Solana remained the champion in both transaction volume and gas revenue, demonstrating its strong main chain strength; Base and Sui increased their activity and showed their potential. Although Ethereum led in capital inflow, its on-chain activity was relatively stable; Berachain, Polygon PoS, etc. faced capital outflow pressure. Overall, mainstream chains consolidated their leading position, and competition among emerging chains intensified.
According to the on-chain data, Bitcoin is currently in the early stages of a structural rebound. Large holders of coins have entered the market first and continued to build positions, becoming an important driver of this round of price recovery. The unspent transaction output (UTXO) on the chain has turned to positive growth since mid-April, and the transaction frequency and network activity have increased simultaneously, indicating that the on-chain momentum has recovered. However, it should be noted that Glassnode data shows that the number of new addresses did not increase significantly during April, and the daily average remained between 300,000 and 350,000, which means that the current recovery is mainly driven by existing users and has not yet ushered in a wide range of new funds.
At the same time, the proportion of profitable addresses quickly rebounded to 93%, reflecting that most investors in the market have returned to a profitable state, panic sentiment has been significantly alleviated, and sentiment is gradually turning to a neutral to bullish state. If prices and on-chain activity indicators continue to strengthen and drive the simultaneous growth of new users, the market is expected to further usher in incremental funds and enter the next round of rising cycle.
Hot Projects and Token Trends
Overview of popular project data
LaunchLab
Raydium, the leading decentralized exchange in the Solana ecosystem, officially launched its token issuance platform LaunchLab on April 16, providing creators and developers with a low-threshold, uncensored on-chain token issuance and liquidity startup tool. [10] Users can issue tokens using a variety of pricing curves (linear, exponential, logarithmic) and quoted assets (such as SOL), and integrate AMM V4 and lock-up mechanisms; creators can also continue to receive 10% of AMM transaction fees after the token graduates.
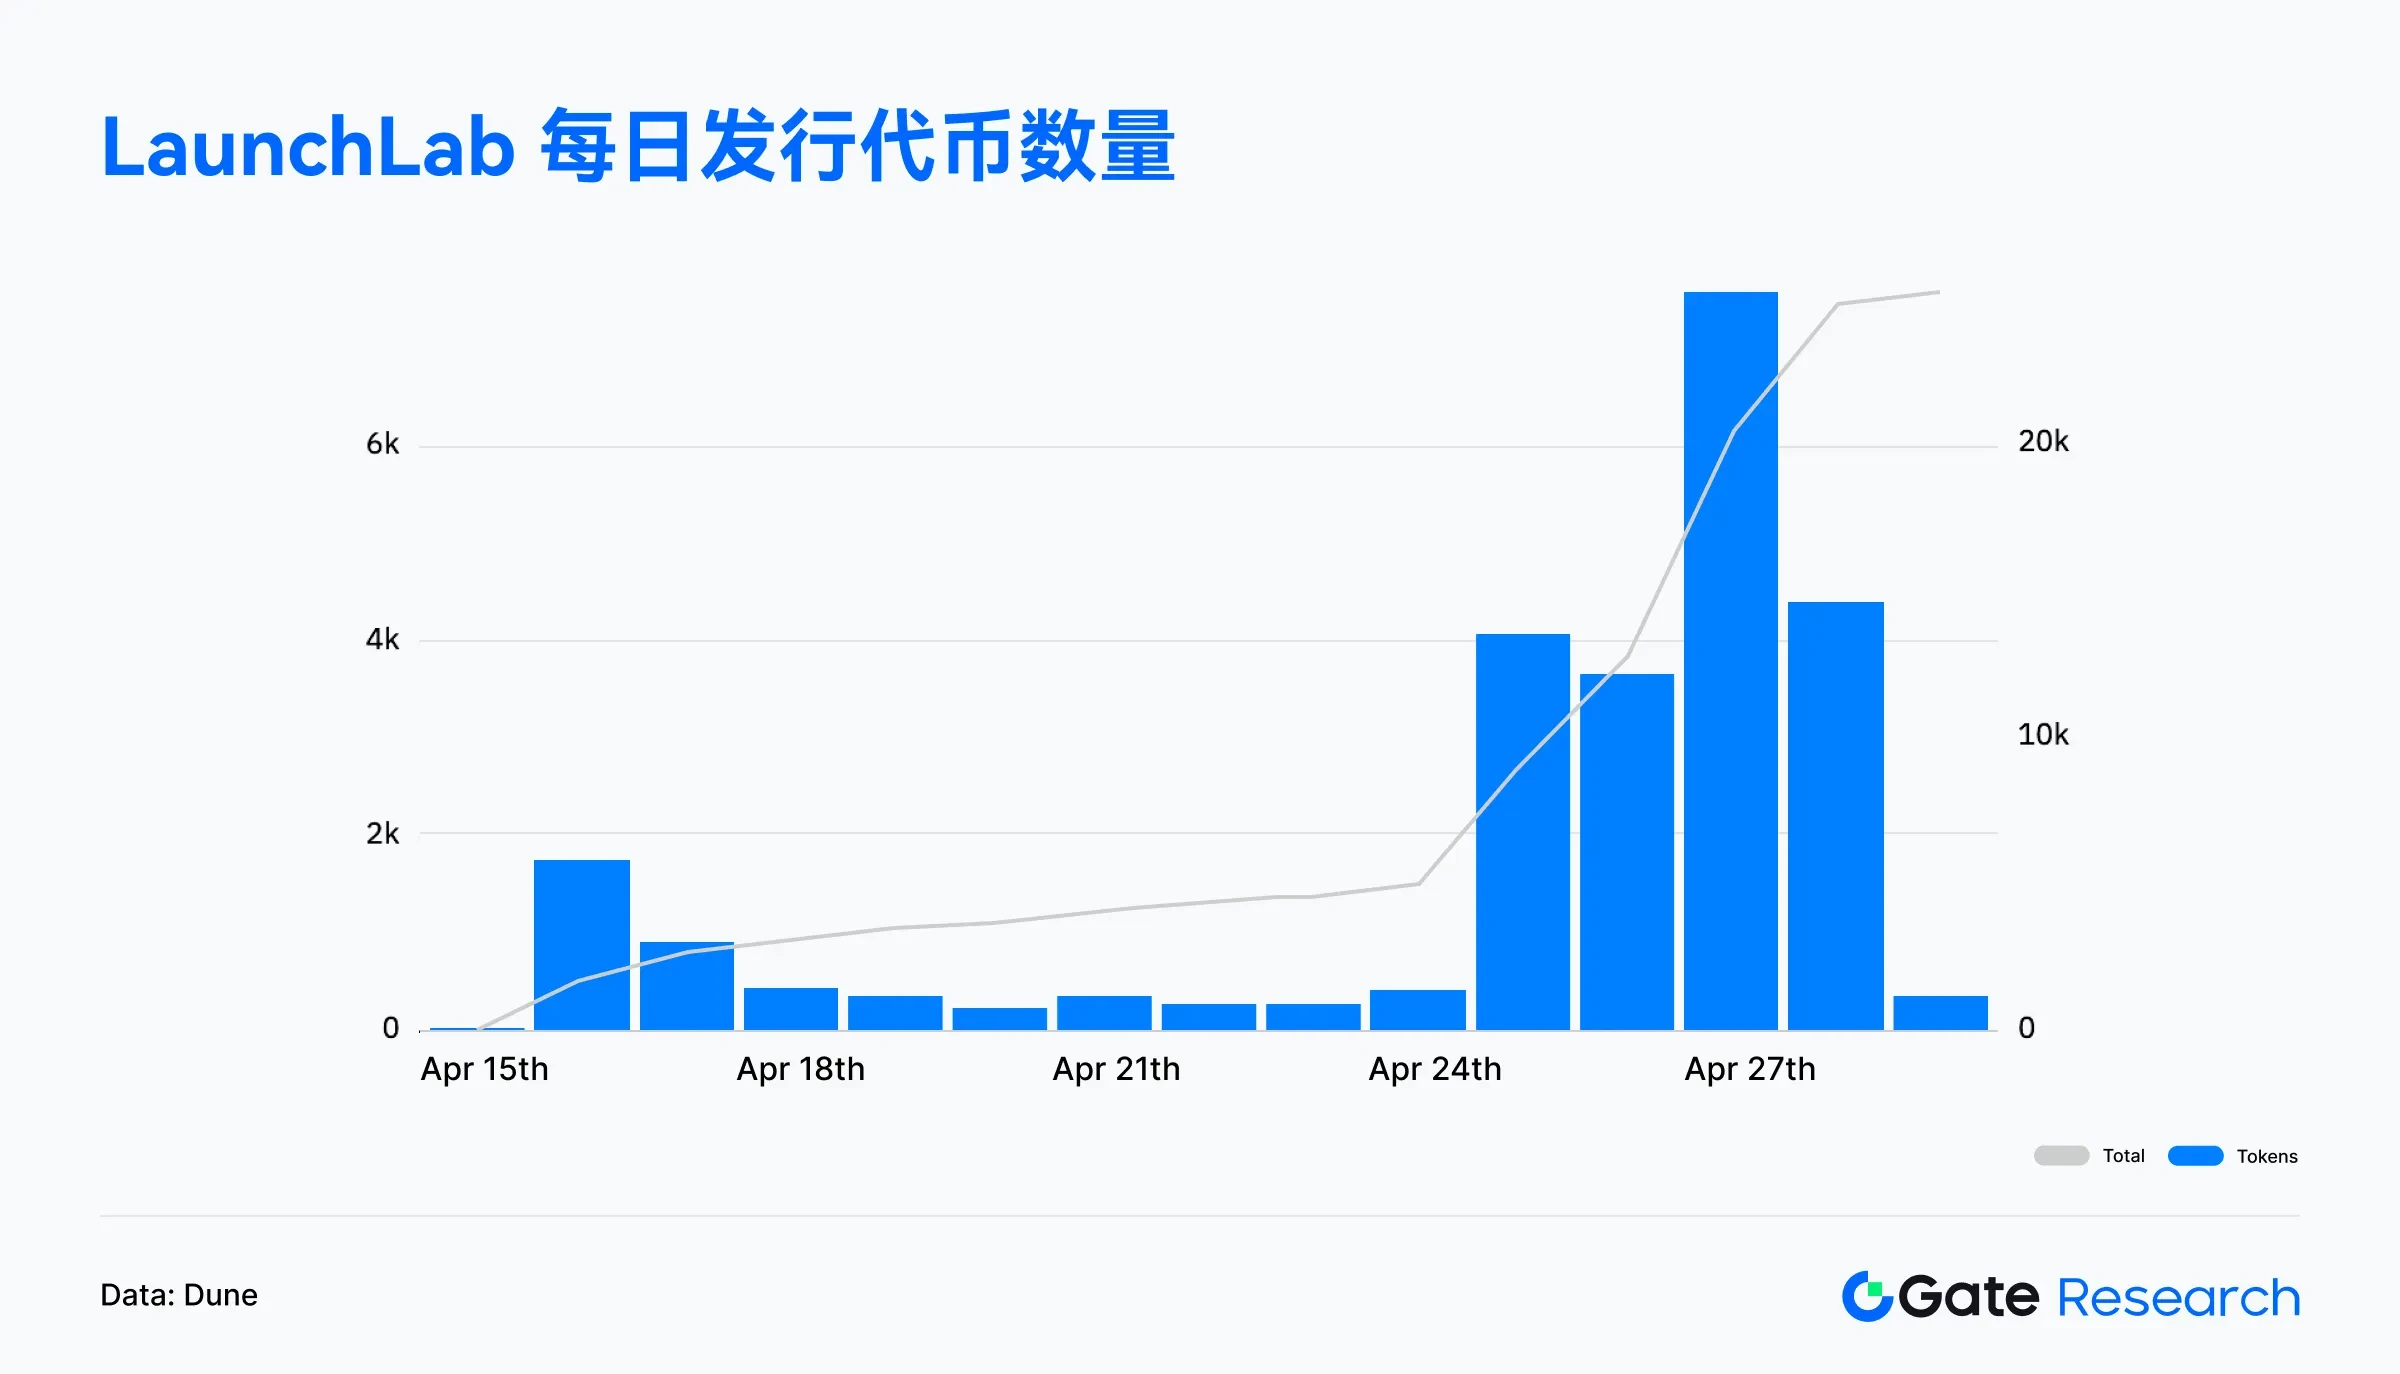
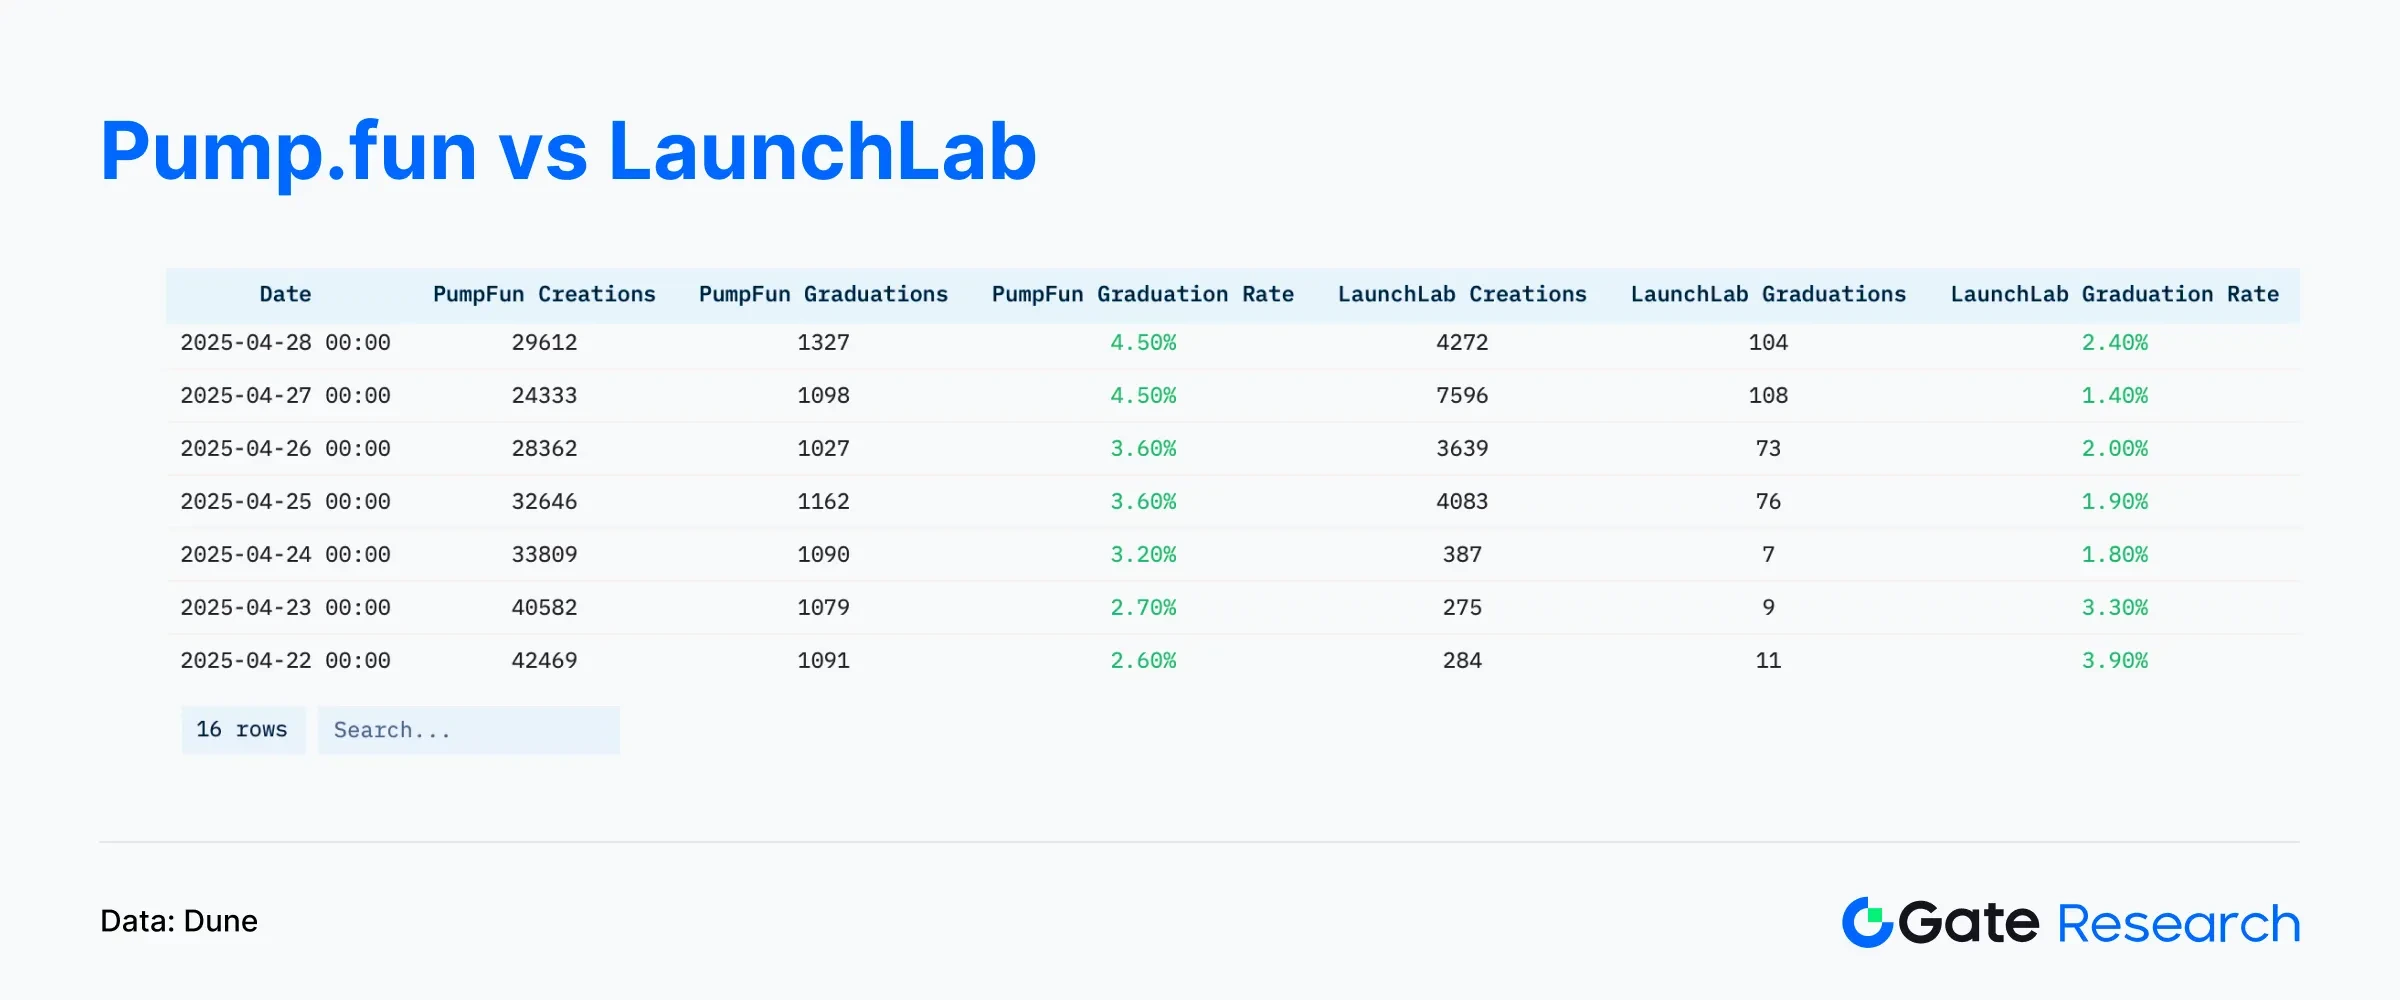
Nearly two weeks after its launch, as of April 28, the LaunchLab platform has created a total of 25,207 tokens, of which only 211 (0.84%) successfully raised funds and migrated to the AMM liquidity pool, indicating that the threshold for success is relatively high. The peak of token creation was concentrated on April 27, with more than 7,500 tokens created in a single day; while the peak of graduated tokens was concentrated on April 25 and 26, with more than 110 tokens graduated in total on those two days. Overall, although LaunchLab has lowered the threshold for token issuance, the success of a project still depends highly on the strength of the team and market recognition. [11]
Taking April 28 as an example, the two major token issuance platforms on the Solana chain formed a sharp contrast:
• Pump.fun created 29,612 tokens, of which 1,327 successfully graduated, with a graduation rate of 4.5%.
• Raydium’s LaunchLab created 4,272 tokens, of which 104 successfully graduated, a graduation rate of 2.4%, significantly lower than Pump.fun. [12]
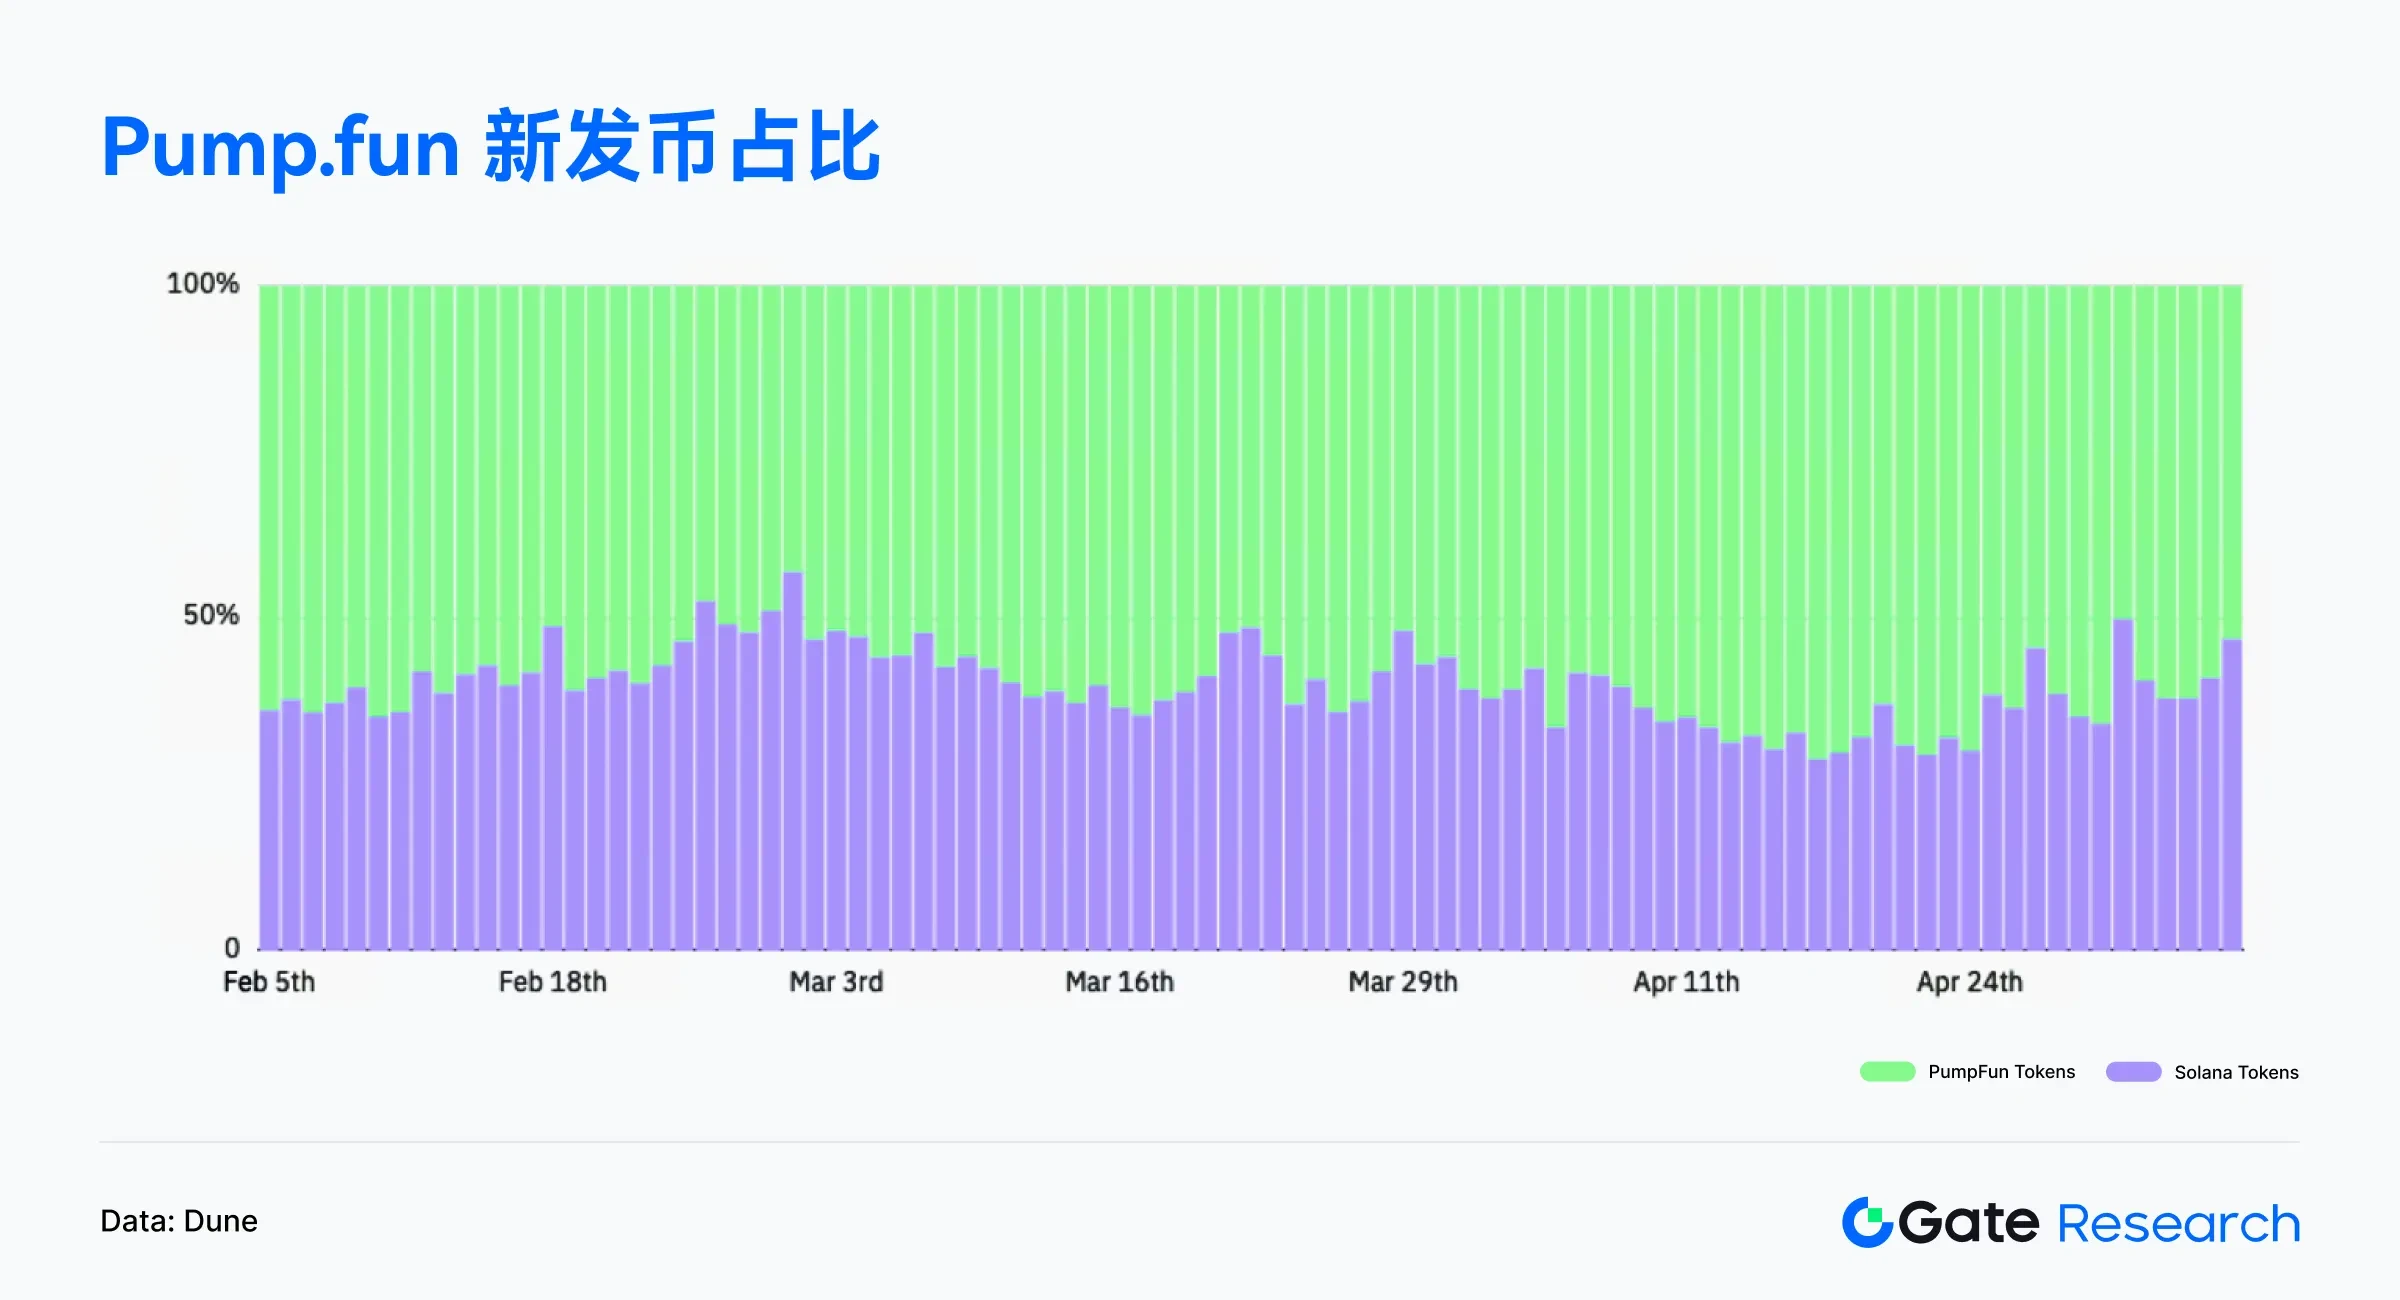
The number of new coins created by Pump.fun has long accounted for the majority of Solanas full-chain issuance. Even after LaunchLab went online, its share remained at a high level. In particular, in early March and late April, Pump.funs daily issuance accounted for more than 65% of the total, showing that it still leads in terms of issuance volume and user activity. Although LaunchLab provides a more flexible issuance mechanism and economic incentives, in terms of penetration and market dominance, Pump.fun is still the most important coin issuance platform on Solana. [13]
Overall, LaunchLab, as a new token issuance platform launched by Raydium, has quickly gathered a large number of creators and project parties in a short period of time, showing strong ecological appeal and innovation vitality on the chain. Although the overall graduation rate is still in the early stages of development, the platform has successfully lowered the issuance threshold, enriched the application and asset diversity on the Solana chain, and laid a solid foundation for the incubation and growth of more high-quality projects in the future. With the continuous improvement of market mechanisms and the gradual maturity of the community ecology, LaunchLab is expected to become an important force in promoting financial innovation and user participation on the Solana chain.
Overview of popular token data
$TRUMP——The TRUMP token is a politician-themed meme coin deployed on high-performance blockchains such as Solana. It is favored by developers for its low transaction costs and convenient issuance mechanism. The token is based on the public image of the current US President Trump and is widely used in the PolitiFi (political finance) sector. It combines community culture, hot events and social media communication, and successfully attracts market attention.
On-chain activity
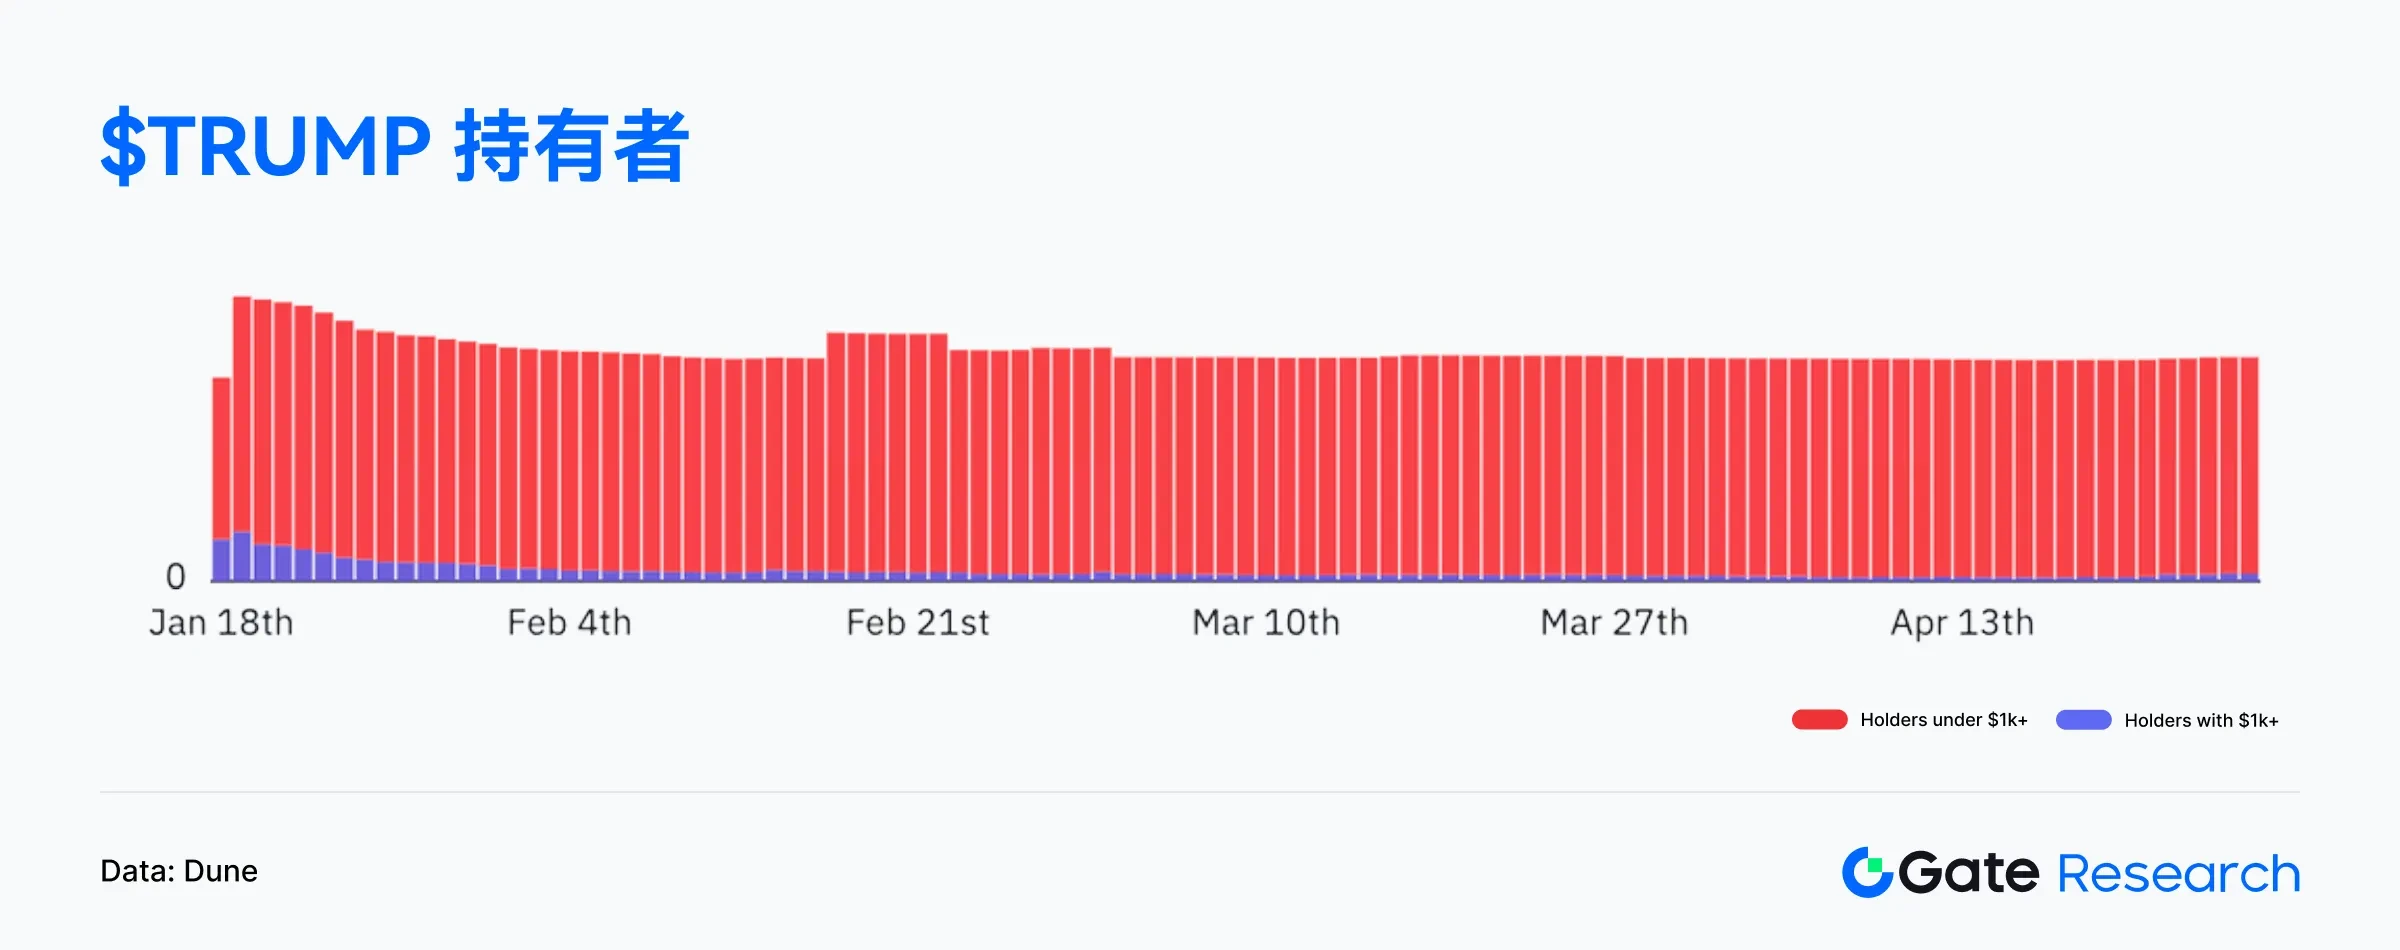
The current surge in $TRUMP prices was mainly driven by market news. On April 24, President Trump announced that he would have dinner with the top 220 $TRUMP holders at a golf club near Washington in May, and specially invited the top 25 holders to participate in a private reception and White House tour. The news quickly spread on social platforms, igniting market sentiment and pushing up the $TRUMP price by more than 50% in a short period of time, becoming one of the core hot spots in the recent Meme coin market. [14]
This event not only significantly increased the on-chain activity of $TRUMP, but also led to the markets renewed attention to the potential of the PolitiFi field. Investors began to actively participate in the competition for holding rankings and paid attention to whether there would be more similar equity incentive mechanisms in the future. On-chain data showed that since the news was announced on April 24, the number of $TRUMP addresses holding more than $1,000 has increased from about 18,000 to 21,900, an increase of more than 21%; the overall number of coin holding addresses has also climbed from 640,000 to 643,000, further confirming that the market enthusiasm has spread from the core community to a wider user group, showing the powerful dissemination and attraction capabilities of political meme coins driven by topics. [15] [16]
It is worth noting that according to Chainalysis data, since $TRUMP went online, its issuing team has accumulated more than $320 million in revenue through transaction fees, reflecting that the project has a strong ability to attract money in addition to hype. On May 5, Trump also once again promoted the dinner to be held on May 22, continuing to amplify market attention and topic volume. This phenomenon highlights the diversification trend of capital flows in the crypto market, and also reminds investors to maintain risk awareness when facing such highly volatile assets and carefully evaluate their long-term value and sustainability. [17]
Summarize
In April 2025, the on-chain ecology showed obvious differentiation. Solana continued to lead the main chain with an average daily transaction volume of more than 93 million and more than 4.5 million daily active addresses. The average daily gas revenue exceeded 1.2 million US dollars, showing that its trading activities were based on real users and benefited from active ecological interactions and the coin creation craze. The activity of Base and Sui increased simultaneously, showing the growth momentum of emerging chains.
The structure of Bitcoin on the chain also continued to improve, with the increase in large addresses, the positive UTXO and the increase in the proportion of profitable addresses (reaching 93%), which jointly supported the restoration of market confidence. However, the number of new addresses remained between 300,000 and 350,000 per day, indicating that the current rebound is still dominated by existing users, and widespread new funds have not yet been fully launched.
In terms of popular projects, LaunchLab of Solana ecosystem quickly gathered creator resources and enriched the asset structure on the chain; the political meme coin $TRUMP achieved a short-term price surge of more than 50% with the help of offline topics and community incentives, and the number of coin holders on the chain has expanded significantly. According to Chainalysis data, its issuing team has accumulated more than 320 million US dollars in handling fees, highlighting its dual advantages in communication and money-making capabilities.
Overall, on-chain activity and capital flows are recovering simultaneously, and ecological development is gradually expanding from the basic chain to the application layer. Combined with the recovery of market sentiment and the recovery of risk appetite, it is worth continuing to track the subsequent on-chain trends of mainstream assets and hot protocols.
References:
1. Artemis, https://app.artemisanalytics.com/chains
2.Artemis, https://app.artemisanalytics.com/chains
3.Artemis, https://app.artemis.xyz/project/solana?from=chainstab=metrics
4. Artemis, https://app.artemisanalytics.com/flows
5.X, https://x.com/glassnode/status/1915315537657180420
6.Glassnode, https://studio.glassnode.com/dashboards/btc-addresses
7.Glassnode, https://studio.glassnode.com/charts/55872440-322a-49c4-7022-499d5 46 b 2 f 98? s= 1729758433u= 1745483233
8. Glassnode, https://studio.glassnode.com/charts/addresses.NewNonZeroCount?ema=0mAvg=0mMedian=0s=1730390400u=1745809904zoom=
9.Glassnode, https://studio.glassnode.com/charts/addresses.ProfitRelative?s=1729758967u=1745483767zoom=182
10.X, https://x.com/RaydiumProtocol/status/1912496080383799632
11.Dune, https://dune.com/maditim/raydium-launchpad
12.Dune, https://dune.com/cryptomancers/memecoins-cold-war
13.Dune, https://dune.com/cryptomancers/memecoins-cold-war
14. Bloomberg, https://www.bloomberg.com/news/articles/2025-04-23/president-trump-to-host-dinner-with-top-holders-of-his-memecoin
15.Dune, https://dune.com/gate_research/official-trump-token
16.Dune, https://dune.com/seoul/trump
17. Fortune, https://fortune.com/crypto/2025/05/06/trump-meme-coin-creators-320-million-fees-presidential-dinner-top-holders/
Gate Research Institute is a comprehensive blockchain and cryptocurrency research platform that provides readers with in-depth content, including technical analysis, hot spot insights, market reviews, industry research, trend forecasts, and macroeconomic policy analysis.
Disclaimer
Investing in the cryptocurrency market involves high risks. Users are advised to conduct independent research and fully understand the nature of the assets and products purchased before making any investment decisions. Gate.io is not responsible for any losses or damages resulting from such investment decisions.


