


This article comes from: hoeem ( @crypthoem )
Compiled by Odaily Planet Daily ( @OdailyChina ); Translated by Azuma ( @azuma_eth )
Editors note: With BTC hitting a new record high and ETH breaking through the $3,000 mark, the market is accelerating upward. Looking at the markets analysis of the reasons for the rise, the topic of interest rate cuts cannot be avoided. This morning, two senior Fed officials once again gave positive signals on the expectation of interest rate cuts.
San Francisco Fed President Mary Daly said last night: I think there may be two rate cuts , but there is uncertainty about everyones expectations, considering a rate cut in the fall.
Waller, a member of the Federal Reserve Board and a potential candidate for the next chairman, said that even if the June employment data was strong, the Fed should still consider cutting interest rates at the July meeting - I have made my point clear. The current policy interest rate level is too high. We can discuss lowering the benchmark interest rate in July... When inflation is going down, we dont need to maintain such a tight policy stance. This is the decision-making logic that the central bank should have.
However, what does the interest rate cut mean for the cryptocurrency market? What stage of the liquidity cycle are we currently in? What signals can be used to observe future changes? Many market participants do not have a clear understanding of these most basic but important questions. In the following, hoeem, a cryptocurrency trader who has been paying attention to the macro environment for a long time, gives his own answers to these questions.
The following is the original content of hoeem, translated by Odaily Planet Daily.
Where are we in the liquidity cycle?
Generational wealth is often created in the transition from tightening to easing. Accurately grasping the position of the liquidity cycle is crucial for investment layout - so what stage are we in now? Let me tell you the answer.
Even if you hate macro analysis, you should pay attention to changes in the liquidity cycle, because central bank liquidity is the lubricant of the global economic engine. Add too much and the market will overheat; pump too hard and the piston will get stuck , and your good life will soon leave you. If you can accurately track the flow of liquidity, you can plan for bubbles and crashes in advance.
2021-2025, four phases of the liquidity cycle
Phase 1: Flooding
Time period: 2020 - 2021;
Fire hydrants on full blast: zero interest rates + unprecedented quantitative easing (QE) + $16 trillion in fiscal stimulus;
The growth rate of global money supply (M2) hit a post-World War II high.
Phase 2: Big Pumping
Time period: 2021 - 2022;
A violent 500 basis point rate hike + quantitative tightening (QT) + expiration of crisis response policies;
The bond market recorded its worst performance in history in 2022 (down about 17%).
Phase 3: Calm period
Time period: 2022 - 2024;
The policy remains tight, but will not be tightened;
Central banks are letting existing policies work to suppress inflation.
Phase 4: Initial Turnaround
Time period: 2024 - 2025;
The world has entered a cycle of interest rate cuts, restrictions have been gradually relaxed, and although interest rates are still relatively high, they have begun to decline globally.
Where We Are in 2025
Standing in the middle of 2025, one of our feet is still in the easing period, but the other foot has begun to turn tentatively. The current stage still presents a combination of high interest rates + continued quantitative tightening, but the policy balance has clearly tilted towards easing, unless a new shock drags us back to the large-scale flooding mode.
For more information, see the Traffic Light Quick Check Table below - I used ChatGPT to organize these contents into a more intuitive table, which can help you see the liquidity comparison between 2017, 2021 and 2025 more clearly.
Odaily Note: In the figure below, 🔴 means not activated, 🟠 means slightly activated, and 🟢 means strongly activated. In addition, it should be noted that the last lever will control the other 11 levers.
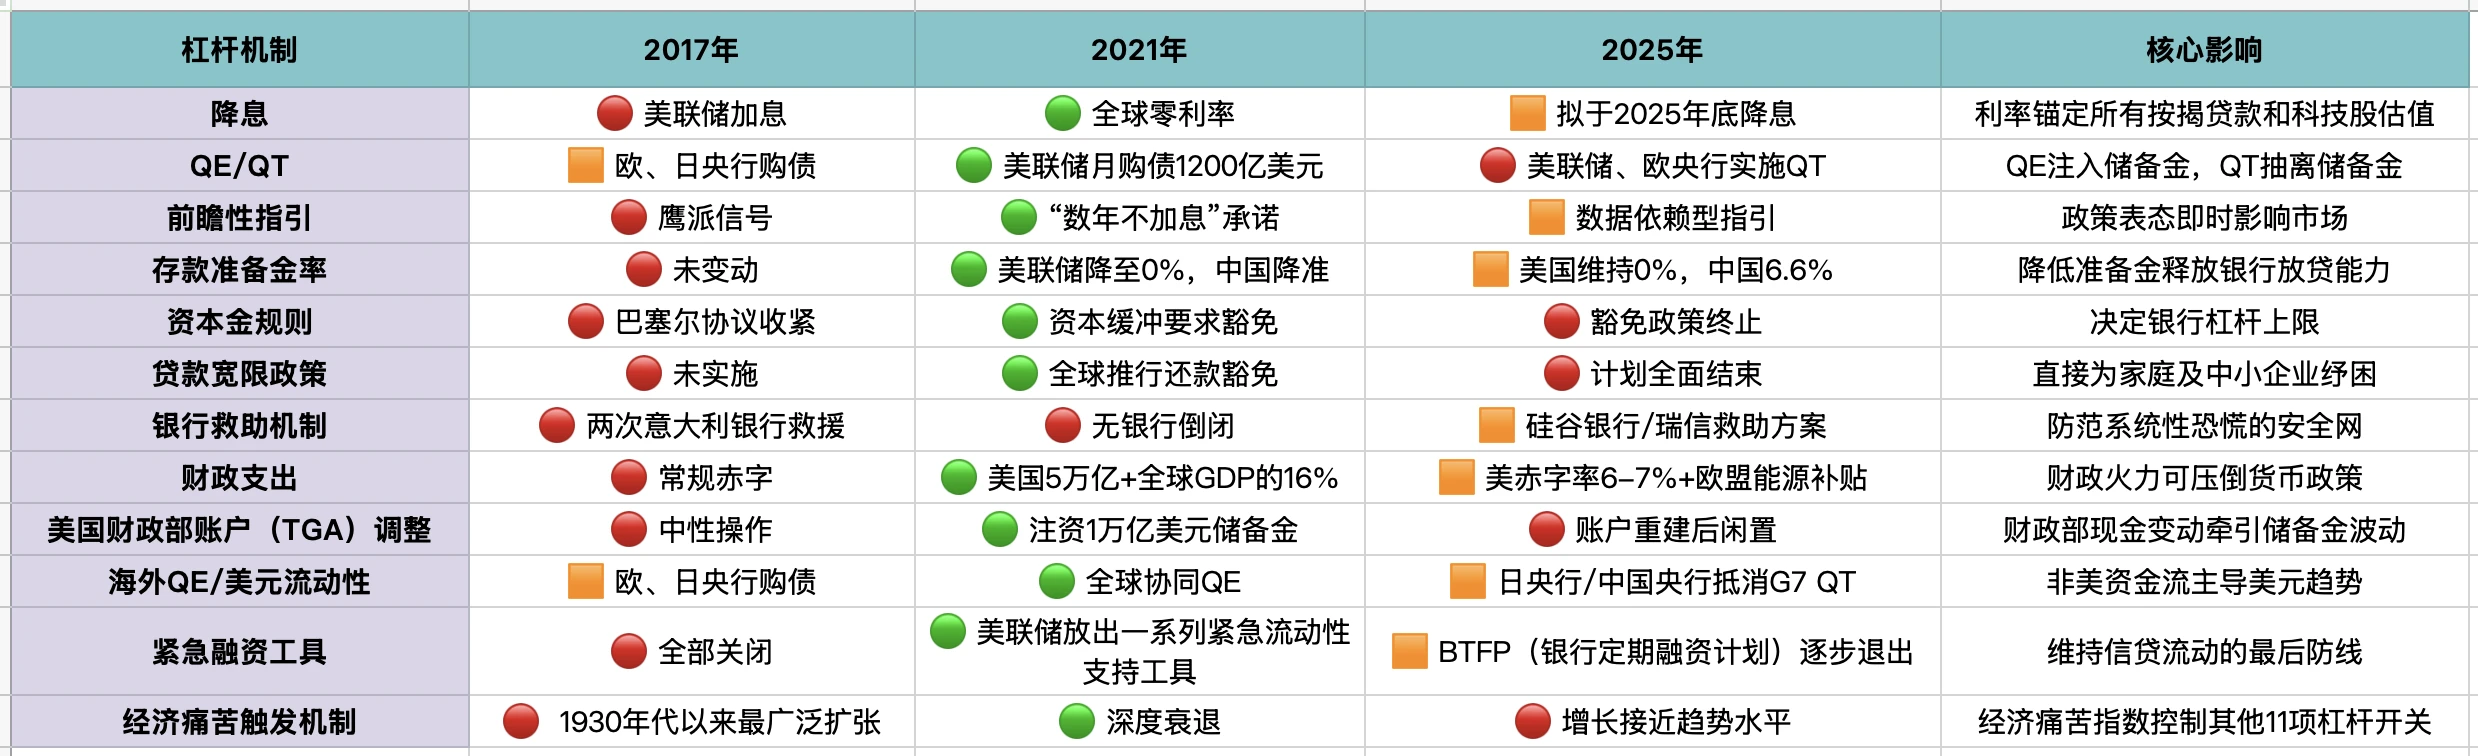
Leverage Mechanism Analysis
Rate cuts
2017: The Fed led the rate hike, and global easing was limited;
2021: A wave of emergency rate cuts swept the world, pushing interest rates close to the zero lower bound;
2025: In order to maintain high interest rates and preserve their anti-inflation credibility, the United States and Europe plan to initiate a moderate interest rate cut at the end of 2025.
Quantitative Easing/Tightening (QE/QT)
2017: The Fed shrinks its balance sheet, and the European and Japanese central banks continue to buy bonds;
2020-2021: Global QE scale breaks historical record;
2025: Policy stance reverses - the Fed insists on QT, the Bank of Japan purchases bonds in unlimited amounts, and China releases liquidity in a targeted manner.
The essence of the liquidity cycle is that QE is the transfusion of blood into the blood vessels, while QT is the slow extraction of blood. Therefore, it is necessary to recognize the switching point of QT/QE and the positioning of the liquidity cycle.
Policy status in mid-2025
Interest rate cut process: The policy interest rate remains high. If Powell’s proposal is implemented, the first interest rate cut may be initiated in the fourth quarter of 2025.
QE/QT dynamics: QT continues to operate, there is no new QE plan yet, but early signals of stimulus policies have emerged.
Four major observation signals
Signal 1: Inflation = 2% and policy announcement risks balanced
Focus: Fed/ECB statements shift to neutral language;
Significance: Clears the last rhetorical hurdle before interest rate cut.
Signal 2: QT suspension (100% reinvestment of maturing bonds)
Focus: FOMC/ECB announces full reinvestment;
Significance: Stop pumping and switch to neutral reserve.
Signal 3: FRA-OIS spread is greater than 25 basis points, or repo rate surges
Focus: Three-month FRA-OIS or GC repo transactions jumped to more than 20 basis points;
Significance: It indicates pressure on US dollar funding and often forces liquidity intervention.
Signal 4: China’s central bank cuts reserve requirement ratio by 25 basis points
Focus: The deposit reserve ratio has been reduced to below 6.35%;
Significance: The release of 400 billion in base currency is often the first domino in the easing of emerging markets.
Popularization Overview
In short, all these complex data boil down to the fact that we have not yet entered a new round of flooding.
So, the markets risk appetite will continue to swing, and there will be no real frenzy unless multiple leverage mechanisms turn green.


